
(Kitco News) – Gold is increasingly finding its way into investor portfolios as the latest gold ETF flow data shows that the yellow metal extended its positive inflow streak to four months, a welcome sight following 11 straight months of outflows.
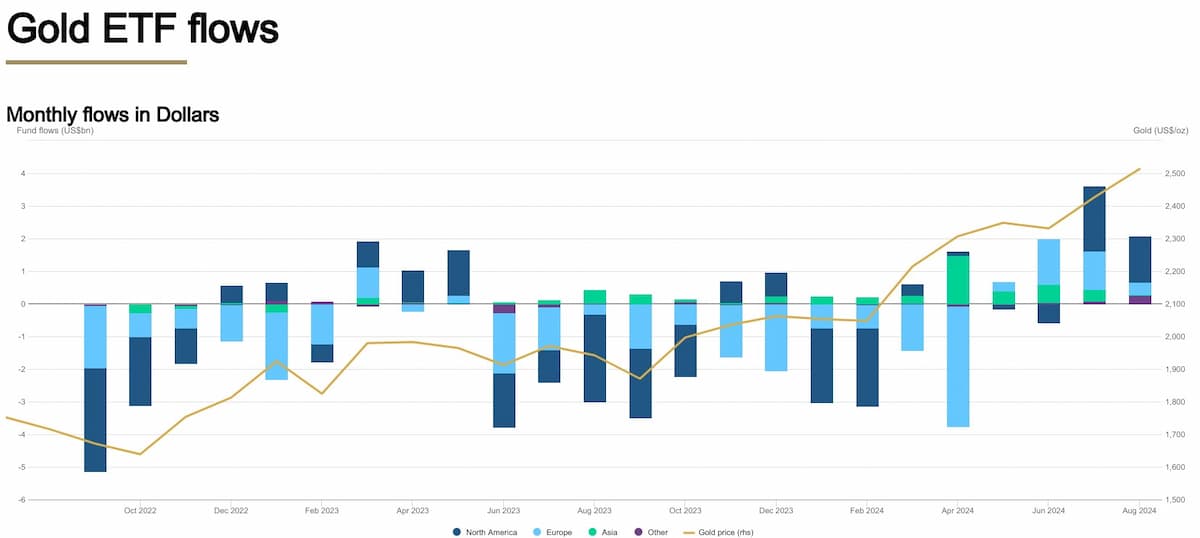
According to a report from the World Gold Council (WGC), a total of $2.1 billion flowed into global physically-backed gold ETFs in August, with all regions reporting positive flows.
“Western funds once again contributed the lion’s share,” the report said. “The 3.6% rise in the gold price, paired with further inflows, lifted global assets under management (AUM) by 4.5% to another month-end peak of US$257bn. Collective holdings continued to rebound, increasing by 29t to reach 3,182t by the end of the month.”
Following the streak of inflows, the year-to-date losses for global gold ETFs narrowed to $1 billion. “The decline in holdings so far in 2024 has also been trimmed down to 44t,” the report said. “Meanwhile, the total AUM jumped by 20% during the first eight months of 2024. Y-t-d, Asia has attracted the largest inflows (+US$3.5bn) while Europe (-US$3.4bn) and North America (-US$1.5bn) lead outflows.”
North America recorded its second month of positive flows, adding $1.4 billion in August, while European funds attracted $362 million and extended their inflow streak to four months. Asian funds continued to see healthy demand, extending their inflow streak to 18 months, albeit slower, as the $32 million added in August was the smallest amount since May 2023.
“Funds in other regions recorded their third consecutive monthly inflow in August, totaling US$264mn, the largest ever,” the report said. “South Africa registered its strongest monthly inflow on record, likely boosted by plunging yields amid cooler-than-expected inflation, which has fuelled expectations for a domestic rate cut next month. Meanwhile, Australia has now recorded three consecutive months of inflows.”
As for global gold trading volumes, they recorded a month-over-month decline of 3.2%, falling to $241 billion per day.
“Average trading volumes over-the-counter (OTC) rose further by 5.9% m/m to US$158bn/day. In tonnage terms, OTC volumes saw a 2% m/m increase,” the report said. “Exchange-traded activities cooled to US$80bn (-18% m/m), mainly due to a 28% m/m decline in COMEX volumes. In contrast, gold trading at the Shanghai Futures Exchange rose by 11% m/m. Global gold ETF trading volumes increased by 17% m/m – mainly contributed by North American funds (+20% m/m).”
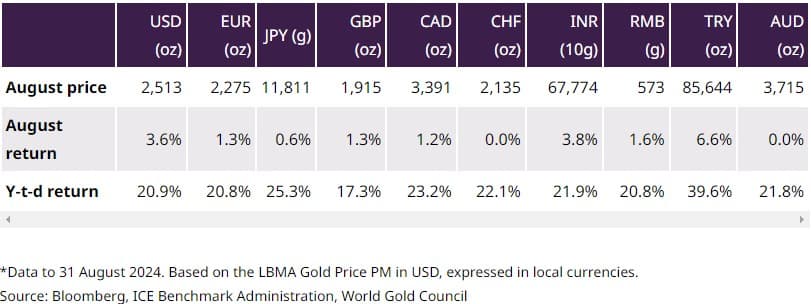
In a separate report, the WGC noted that the positive flows helped push gold prices higher, with a 3.6% increase to $2,513 per ounce for the month of August.
“It also reached a new all-time on 20 August before a very marginal decline into month-end,” the report said. “According to our Gold Return Attribution Model (GRAM), gold was pulled higher by a material drop in the US dollar and, to a lesser extent, lower 10-year Treasury yields as the Fed signalled the time had come for rate cuts. The main identifiable negative contribution came from a momentum factor, the gold return in the previous month, i.e. when high, the following month typically sees a lower return and vice versa.”
As a result of increased demand, gold prices saw gains “in almost all major currencies despite a materially weaker U.S. dollar,” the WGC said.
Looking ahead, the report noted that “The current macro environment is tough to read due to the swirl of contradictory economic data releases.”
“Globally, top line data still looks quite good. GDP growth is ticking along at 2.5% and composite PMIs remain positive,” the report said. “But services, which account for the lion’s share of output, are supporting those numbers and disguising the fact that manufacturing remains in a bit of a slump, particularly in Europe and China.”
For the U.S., “The situation also appears to be in flux,” the WGC said. “Composite PMIs are mildly in expansion, mirroring the global picture. Retail sales have been upbeat, the stock market – following a mini lurch – keeps powering ahead, and consumer sentiment perked up recently.”
“On the flipside, unemployment jumped to 4.3% in July, a big enough leap to invoke the Sahm Rule, while loan delinquencies are rising fast, and leading indicators as well as the yield curve keep screaming recession,” they added.
The WGC said that “A soft landing still looks the most likely outcome, particularly as Fed Chair Jerome Powell set the stage for a series of interest rate cuts in his annual address at Jackson Hole.”
“The Fed will have to navigate between pre-emptively avoiding a recession and the risk of inflation picking up again,” they said. “The latter would arguably be far more damaging.”
The report also noted that “Gold ‘spreading’ positions in options, a normally quieter corner of the gold market, are at a multi-year high, suggesting that investors are either hedging or speculating on both a rate-cutting cycle and the outcome of the US election.”
“Options spreading positions (OSP) within the CFTC’s Commitment of Traders report have been steadily rising, nearing levels not seen since 2019-2020, and before that, 2013 and 2011,” the report said. “These positions are dominated by the ‘other reportable’ category, which anecdotally is most likely to reflect the activity of Commodity Trading Advisors (CTAs), firms that focus primarily on price trends.”
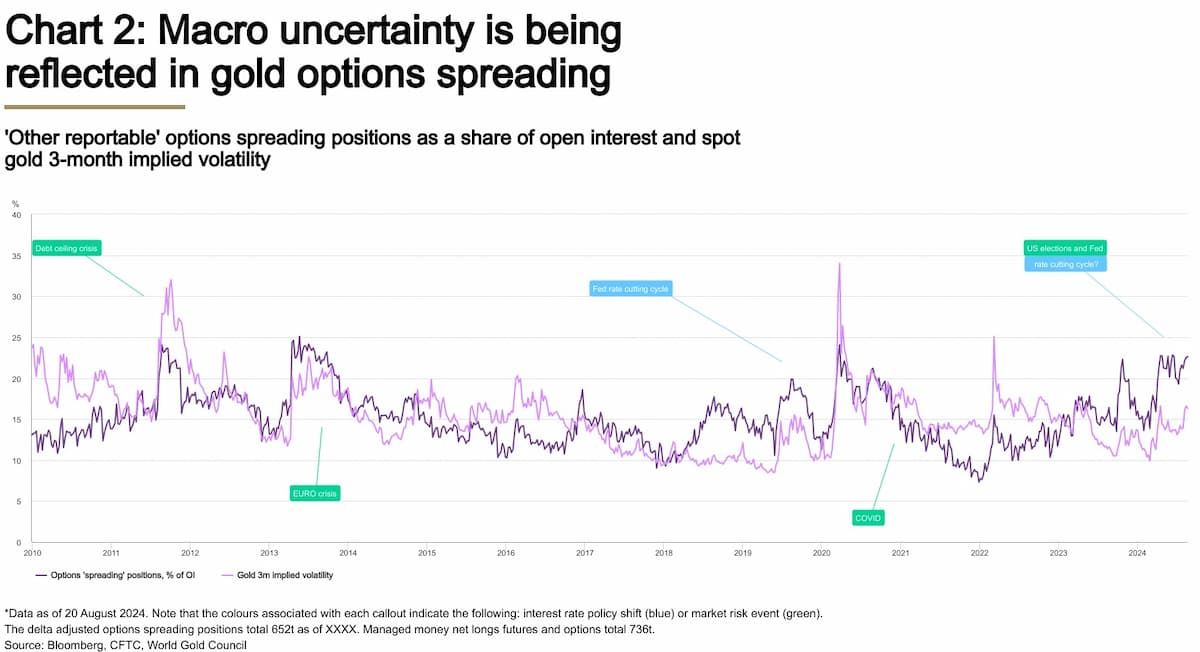
The report said the triggers for the rise in OSP activity “were linked to one of two scenarios: either an interest rate policy shift (blue) or a market risk event (green),” and warned that “Today, we face both.”
“Markets expect the Fed to embark on a surprisingly aggressive rate-cutting path in September and we have a systemically critical US election in early November,” the WGC said.
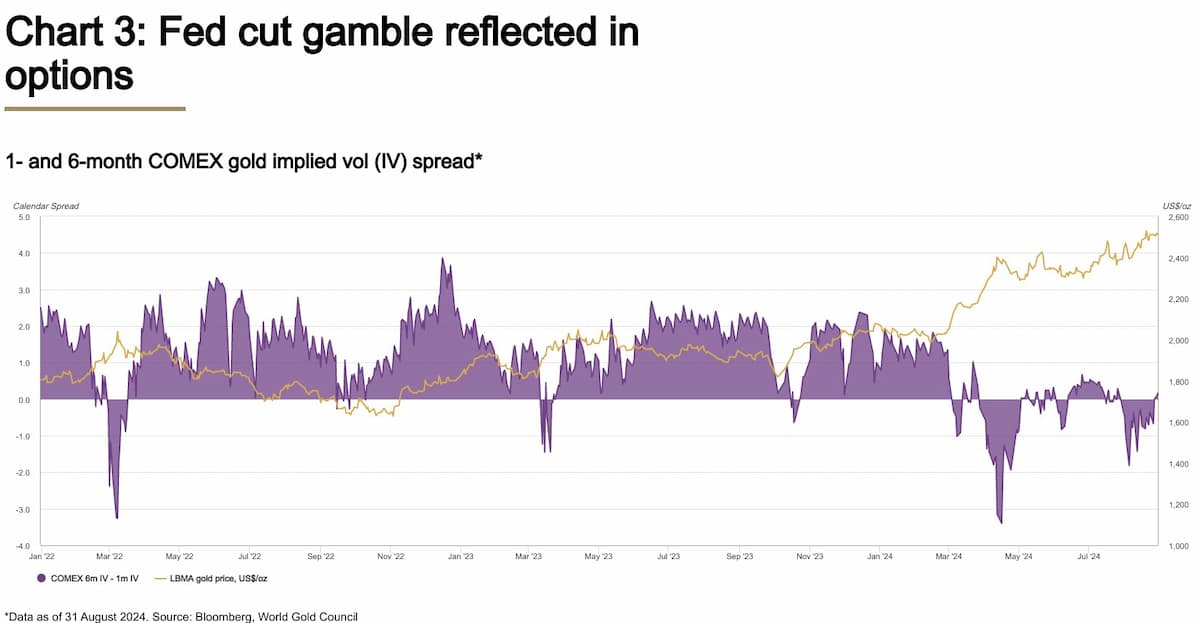
“While the OSP data doesn’t reveal the nature of the spread positions, the difference in implied volatility (IV) at different maturities provides clues (Chart 3),” they added. “This shows that short-term IV remains unusually high relative to longer-term IV, plausibly reflecting the gravity of monetary policy and election developments of late.”
Due to the rising uncertainty, the WGC said it’s “no surprise that investors have taken to the options market to hedge against, or speculate on, these seemingly binary outcomes, particularly given the tensions surrounding the US election in November. For instance, we continue to see elevated flows into equity options, which have now surpassed the previous all-time high back in Q4 2023.”
“It is likely that the calendar spread reverts to its normal positive level if and when policy rate uncertainty wanes – likely following the September Fed meeting,” they added. “Then election outcomes might start to dominate. But this, in our view, should maintain positive sentiment as conditions for gold remain positive regardless of which party wins.”
“We can only speculate on how broader macro data might influence market reactions, but it seems likely that both election dynamics and expectations of rate cuts have increased activity in gold, as seen in options ‘spreading’ positioning,” the WGC said. “Under these circumstances it is reasonable that investors are more focused on the near-term outlook. Their behaviour suggests that they view gold as a hedge against immediate event risks while also positioning it as a beneficiary of lower interest rates.”
“Outside of the US, the continuing slowdown in China is likely to impact consumers’ capacity and willingness to buy gold – certainly when it comes to jewellery,” the report concluded. “But even China’s gold ETFs saw outflows last month in contrast to the pickup in Indian ETF demand and welcome return of Western ETF inflows.”