

(Kitco News) – Bitcoin (BTC) and gold continued to see rising fortunes on Thursday as investors scrambled to safe havens following an uptick in fighting between Ukraine and Russia. Stocks also bounced back, showing signs of recovery after their Nvidia-inspired pullback.
On the macroeconomic data front, the latest weekly jobless claim report showed 213,000 new claims for unemployment, a decline from the week prior. This further tempered expectations for an interest rate cut in December, with the CME FedWatch tool now showing that Wall Street puts the odds of a cut next month at 56%, down from 72% last week.
After whipsawing in early trading, stocks climbed higher into the close, with the S&P, Dow, and Nasdaq all finishing in the green, up 0.74%, 1.27%, and 0.12%, respectively.
Gold prices climbed throughout the day, with the spot price rising from $2,657/oz to hit a high of $2,673/oz. At the time of writing, spot gold trades at $2,668.10 for a gain of 0.70% on the session.
On top of the normal post-halving rally for Bitcoin, King Crypto got an extra boost in trading on Thursday after Securities and Exchange Commission (SEC) Chair Gary Gensler announced he would be stepping down from his position on January 20, 2025.
Data provided by TradingView showed the breaking news of Gensler’s departure coincided with a pump in Bitcoin’s price to a new all-time high of $99,075 on Coinbase. Crypto advocates have long called for Gensler’s ouster, and the ensuing excitement led to a spike in trading volume.
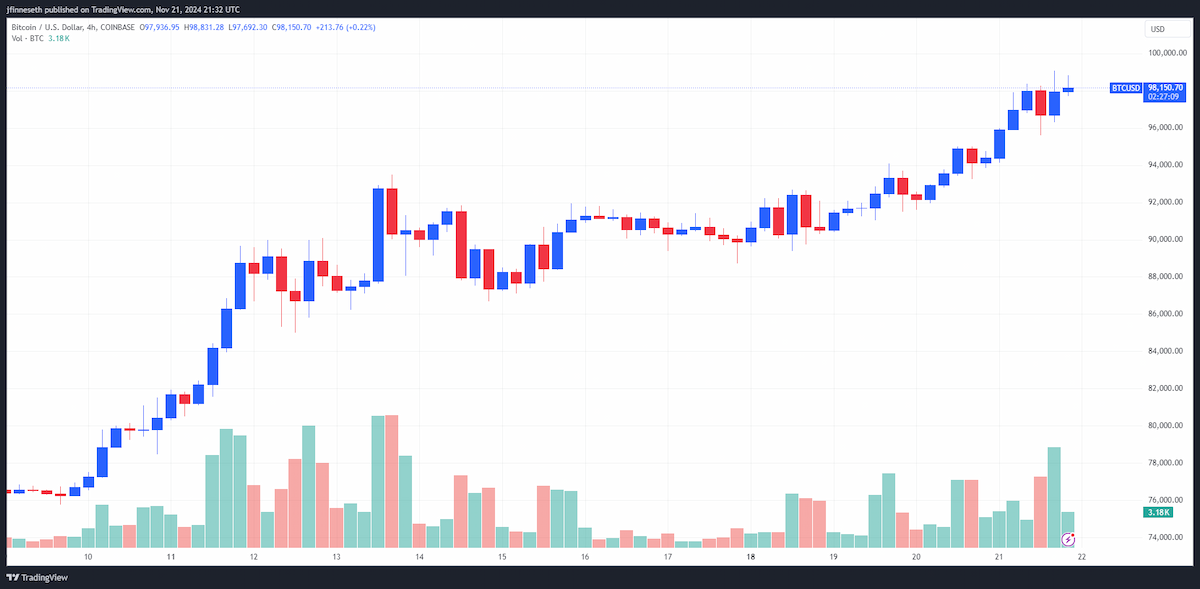
BTC/USD Chart by TradingView
“The cryptocurrency market displayed robust dynamics early today as Bitcoin surpassed the $99,000 threshold, driven by anticipatory sentiment around regulatory frameworks favorable to the sector emerging from a prospective second term for Donald Trump,” noted analysts at Secure Digital Markets. “Despite Bitcoin's technically overbought status, market participants are captivated by the strategic opportunities, particularly as the asset approaches the psychologically significant $100,000 mark, which may pose resistance in the near term.”
“Bitcoin is on the cusp of attaining a $2 trillion market capitalization, a feat achievable at a price point of $101,000,” they added. “Furthermore, record levels of open interest in Bitcoin futures on the CME, totaling 218,000 BTC ($21.3 billion), underscore a prevailing bullish sentiment. As Bitcoin becomes further entwined with conventional financial systems, expectations are that its volatility will diminish over time.”
At the time of writing, Bitcoin trades at $98,090, an increase of 3.93% on the 24-hour chart.
One final flush-out amid parabolic upswing
With Bitcoin’s 42% rally since the day after the U.S. elections, market analysts widely agree that the parabolic phase of its post-halving cycle is now underway.
“It's beyond doubt now that Bitcoin (BTCUSD) has started the new Parabolic Rally (PR), technically the most aggressive phase of the Bull Cycle,” said TradingView analyst TradingShot. “We've made numerous analyses in the past explaining on time why we expected this break-out to take place after 7 months of accumulation.”
“What we bring to you today is the SPX/RUT ratio, the correlation of the S&P500 (SPX) and Russell 2000 (RUT) indices against BTC, and how it confirms that this rally will now accelerate to a pace that it won't be easy to get caught (i.e. bought),” he said.
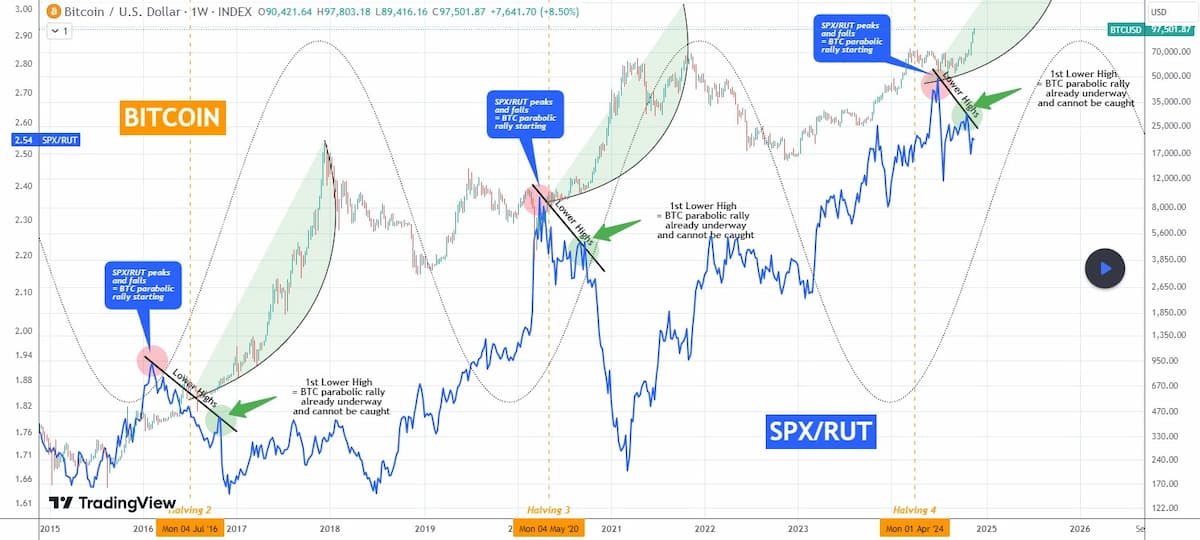
“The SPX/RUT ratio is displayed by the blue trend-line,” TradingShot noted. “The ratio is particularly helpful during Bitcoin's Parabolic Rally phase as their correlation is mostly a negative one, meaning when the ratio falls, Bitcoin rises.”
“On this chart, this correlation is present on a cyclical basis,” he explained. “This means that during every Cycle, it displays a behavioral pattern that is common.”
“The key characteristic here is the Lower Highs pattern that the ratio forms every Cycle around the Halving time,” TradingShot highlighted. “As you can see, when SPX/RUT peaks (red circle) and starts forming Lower Highs, Bitcoin stars its Parabolic Rally (green arc).”
“On the 1st Lower High, BTC's rally is already underway and has entered the stage where due to the sheer buying pressure and aggression, getting an entry is difficult,” he said. “The Lower Highs on SPX/RUT also signify a shift from big capitalization stocks to low, i.e. an increasing appetite for riskier assets and that transcends to the Bitcoin market as well.”
Market analyst Gert van Lagen highlighted that Bitcoin’s recent rally higher was the steepest ascent in its price history.
[UPDATE]
Now $BTC left Base 4, the steepest kind of ascent $BTC has ever witnessed is being witnessed. #blowofftop pic.twitter.com/nSij1yLv0y— Gert van Lagen (@GertvanLagen) November 21, 2024
But MN Consultancy founder Michaël van de Poppe warned traders about getting overly bullish about Bitcoin hitting $100,000, as he still sees a significant pullback ahead before any meaningful rally above $100,000.
The theory still stands on $BTC.
We'll have a massive sweep/flash crash downwards causing #Altcoins to drop massively.
From that point --> rotation game happens and we're having a multi-month altseason.
Before that happens, $100K per one Bitcoin is around the corner. pic.twitter.com/LxRzxwMPaB— Michaël van de Poppe (@CryptoMichNL) November 21, 2024
After the pullback occurs, Poppe sees significant upside for altcoins, along with further gains for Bitcoin. Market analyst Moustache aligned with Poppe in the last regard and said if Bitcoin mirrored its performance in 2017, “then we'll see the biggest Altcoin season in 8 years.”
#Bitcoin 2017 vs. #Bitcoin 2024
If I'm right, and $BTC copies 2017, then we'll see the biggest Altcoin season in 8 years. pic.twitter.com/PrTV73H5BL— ???????ⓗ? ? (@el_crypto_prof) November 21, 2024
Altcoins follow Bitcoin’s lead higher
Bitcoin’s surge led to a rally in the altcoin market, resulting in most tokens in the top 200 recording gains on Thursday afternoon.
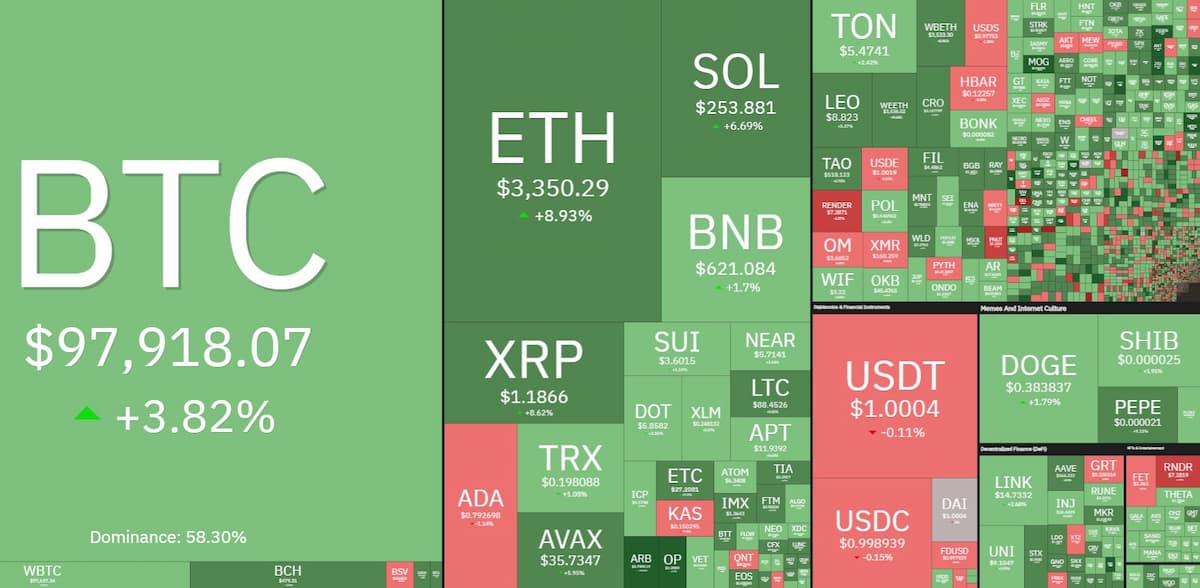
Daily cryptocurrency market performance. Source: Coin360
Optimism (OP) was the biggest gainer, increasing by 25.9%, followed by gains of 25.3% and 24% for ether.fi (ETHFI) and Mog Coin (MOG), respectively. Peanut the Squirrel (PNUT) saw the largest decline, falling 10%, while Render (RNDR) lost 5.3%, and AIOZ Network (AIOZ) fell 4.5%.
The overall cryptocurrency market cap now stands at $3.25 trillion, and Bitcoin’s dominance rate is 59.8%.