
(Kitco News) - Gold and silver prices are sharply lower in midday U.S. trading Wednesday, on corrective pullbacks and profit taking following recent solid gains. Weak-handed longs in the gold and silver futures markets are also being forced to liquidate their recently established positions. June gold was last down $31.60 at $2,394.40. July silver was last down $0.523 at $31.555.
A Wall Street Journal report today said gold’s rally the past several months has been mostly due to buying buy central banks and especially China. The Journal said central banks of the world are starting to diversify more away from U.S. dollar-based assets that can be more easily sanctioned. The report said U.S. economic sanctions on Russia, following its invasion of Ukraine, that have helped to crimp Russia’s economy, were sort of a wake-up call for countries like China, which could also be sanctioned by the U.S. The Journal report is headlined: “Gold’s latest allure? It’s sanctions proof.”
U.S. stock indexes are mixed at midday. The U.S. stock indexes are not far below their recent record highs. However, a Barrons.com story today is headlined: The market’s fear gauge is signaling trouble.” The story said the CBOE’s VIX index, which measures implied volatility, is very low at present, suggesting low fear in the marketplace. The story said “investors get greedy” during a low VIX. “History suggests something’s has to give.”
The U.S. data point of the day Wednesday, if not the week, is the afternoon release of the minutes from the last FOMC meeting of the Federal Reserve.
Another WSJ story this week is titled: “China tightens minerals grip as West fails to make headway.” The story highlights China’s stockpiling of minerals like nickel, lithium and cobalt that are critical for defense and green technology. Western countries are falling behind China is securing these minerals, said the WSJ.
The key outside markets today see the U.S. dollar index slightly higher. Nymex crude oil prices are mildly down and trading around $78.25 a barrel. The yield on the benchmark 10-year U.S. Treasury note is fetching around 4.45%.
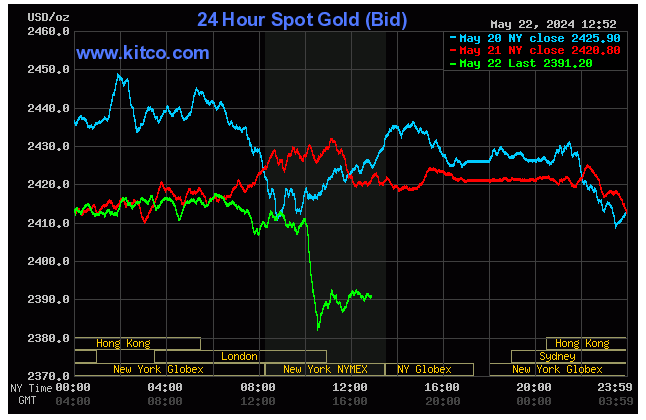
Technically, June gold futures bulls still have the solid overall near-term technical advantage. However, there is now the possibility of a bearish double-top reversal pattern forming on the daily bar chart. Bulls’ next upside price objective is to produce a close above solid resistance at the record high of $2,454.20. Bears' next near-term downside price objective is pushing futures prices below solid technical support at $2,350.00. First resistance is seen at $2,415.00 and then at today’s high of $2,430.50. First support is seen at today’s low of $2,385.30 and then at $2,375.00. Wyckoff's Market Rating: 7.5.
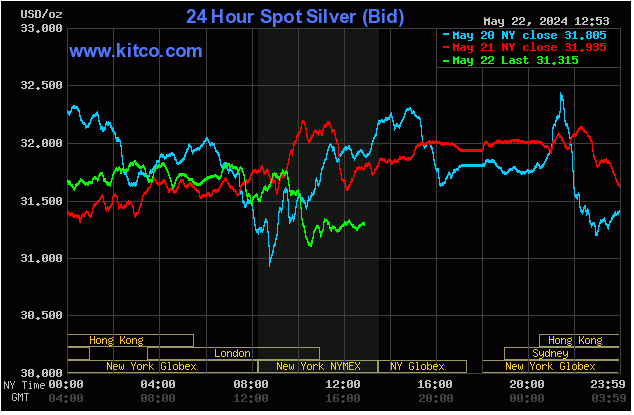
July silver futures bulls have the solid overall near-term technical advantage. Prices are in a steep, three-week-old uptrend on the daily bar chart. Silver bulls' next upside price objective is closing prices above solid technical resistance at $33.00. The next downside price objective for the bears is closing prices below solid support at $30.00. First resistance is seen at $32.00 and then at $32.50. Next support is seen at this week’s low of $31.18 and then at $31.00. Wyckoff's Market Rating: 7.5.
July N.Y. copper closed down 2,610 points at 484.50 cents today. Prices closed near the session low on heavy profit taking and weak long liquidation after hitting a record high of 519.90 cents Monday. The copper bulls have the firm overall near-term technical advantage but faded today. Prices are still in a 3.5-month-old uptrend on the daily bar chart. Copper bulls' next upside price objective is pushing and closing prices above solid technical resistance at 519.90 cents. The next downside price objective for the bears is closing prices below solid technical support at 460.00 cents. First resistance is seen at 500.00 cents and then at today’s high of 513.30 cents. First support is seen at today’s low of 482.45 cents and then at 470.00 cents. Wyckoff's Market Rating: 7.0.
