

(Kitco News) – Markets were buffeted by a second day of volatility as the “September curse” continued to roil investors, with asset prices from stocks to crypto and gold struggling to generate positive momentum.
Equities collectively saw more than $1 trillion in value exit from the market on Tuesday, stoking fears of a recession and the often-warned turnover in the stock market, which had roared back to life following the early August yen carry trade unwind-inspired pullback.
Recession fears were amplified by the fact that the inversion between the U.S. two- and 10-year Treasury yields turned positive for the first time in two years, a development that has historically indicated that a recession is likely in the near future.
Yield curve flips positive. Longest period in history of an inverted yield curve comes to a close. Historically, un-inversion has signaled the beginning a recession.
— Gareth Soloway (@GarethSoloway) September 4, 2024
Nvidia (NVDA), the stock market darling that propelled the Nasdaq higher, has been a focal point for the pullback, falling nearly 25% from its record high set in June and erasing $1 trillion in value all by itself.
“According to Bloomberg, the U.S. Department of Justice has escalated its antitrust investigation into Nvidia and several other companies by issuing subpoenas,” said analysts at Secure Digital Markets. “Previously, the Department had relied on non-binding questionnaires, but recent developments indicate a more aggressive approach to gathering information. Nvidia's stock reacted sharply to the news, plunging 9.5% by the close of trading on September 3 to $108, and continuing its decline by another 2% in after-hours trading, reaching $105.”
“Regulators are reportedly concerned that Nvidia may be engaging in practices that hinder customers from transitioning to alternative chip manufacturers and AI service providers, as well as penalizing those who do not solely rely on its AI services,” they noted. “As part of this probe, the Department of Justice has also reached out to other tech giants, including Microsoft, one of Nvidia’s largest shareholders, seeking additional insights.”
“Nvidia, however, has firmly denied the allegations,” the analysts said. “In a statement provided to Bloomberg, the company emphasized that it competes based on merit, with its superior test results and value proposition offering customers the freedom to select the best solutions for their needs.”
Wednesday saw the slide for NVDA continue, albeit at a slower pace, as the stock closed the day down 1.66% and traded at $106.21. The broader stock market also slid lower, with the S&P and Nasdaq finishing down 0.16% and 0.30%, respectively, while the Dow gained 0.09%.
Data provided by TradingView shows that Bitcoin (BTC) fell below support at $56k in the early hours on Wednesday, hitting a low of $55,567 before bulls jumped in and pushed it back above $58,000 near midday.
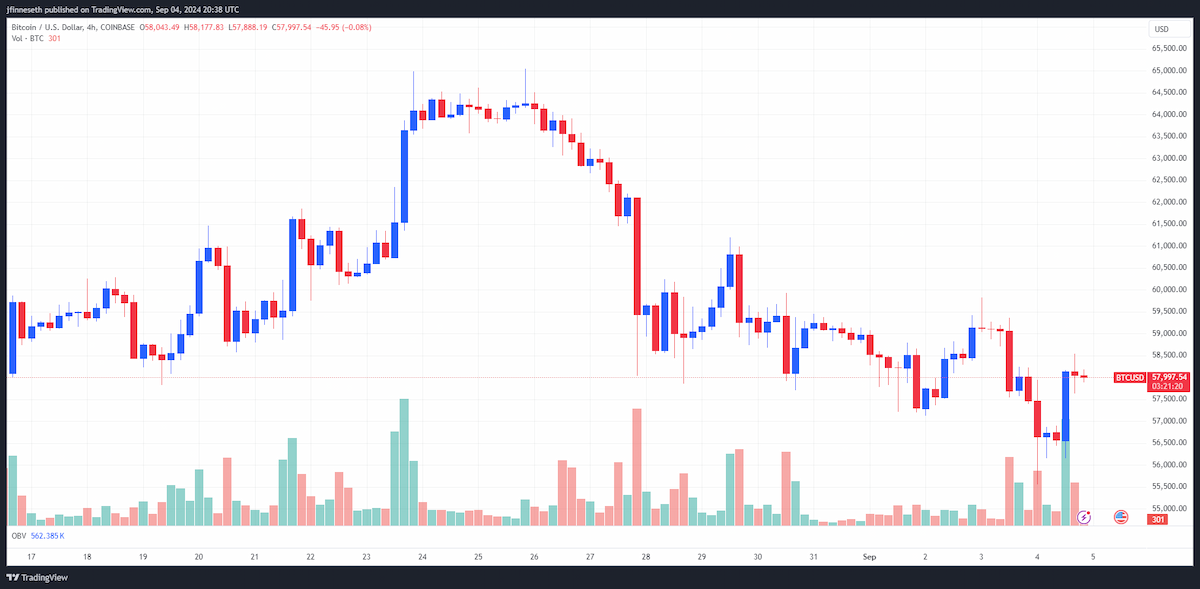
BTC/USD Chart by TradingView
At the time of writing, BTC trades at $58,008, a decrease of 0.23% on the 24-hour chart.
Mixed signals suggest caution
Discussing Wednesday’s recovery, analysts at Secure Digital Markets said it “aligns with bullish reversal signals indicated by certain momentum oscillators on the 4-hour chart.”
“Bullish divergence has been forming on the RSI since last week, suggesting a potential weakening of selling pressure,” they said. “Despite these short-term signals, longer-term technical indicators remain unclear, with Bitcoin still trading in the middle of its long-term descending channel, offering no clear directional bias.”
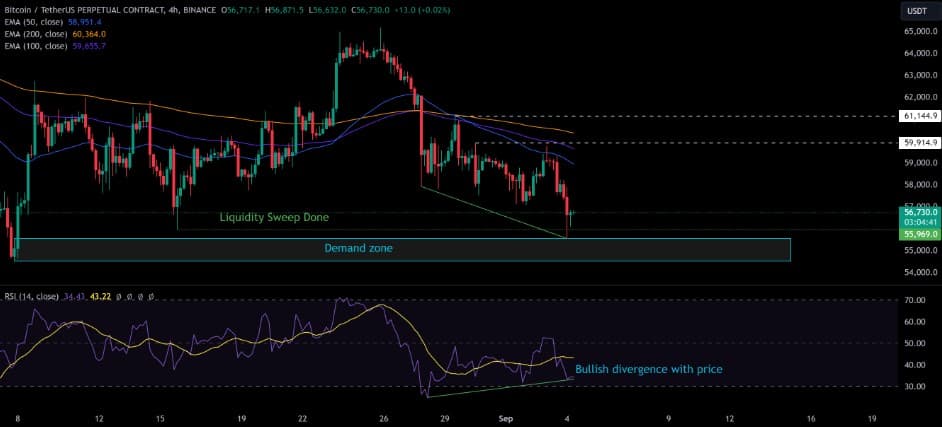
Market analyst Bloodgood warned that the weakness may persist for a little longer and could result in Bitcoin falling below $50,000.
“Red candles continue for Bitcoin,” Bloodgood said in his latest market update. “Last week, we discussed that the accumulation zone looked weak, and we saw a breakdown of that level before the week ended.”

“Breaking below the accumulation zone potentially confirms our theory that a new low is possible,” he wanted. “If that’s the case, then $46,700 is on the table, and it wouldn’t be unwise to place some bids around that level. This theory will be invalidated if bulls manage to push Bitcoin back above the breakdown area at around $59k.”
Looking beyond the day-to-day price movements of Bitcoin and assets like NVDA, Bloodgood said that the real driver of markets continues to be the Federal Reserve.
“Last week, I mentioned the NVIDIA earnings report—sure enough, it had quite an impact on the market,” he wrote. “The company’s numbers did manage to beat estimates, but only by around 5%, which wasn’t enough to justify its insane valuation. The stock tumbled almost 20% over the following days, bringing much of the market down with it.”
“The key point here, however, is that this doesn’t change the longer-term outlook for crypto one bit,” he added. “What will matter much more is how the Fed and the Treasury will act to stabilize the stock market and keep bond yields at an acceptable level. Given that elections are just around the corner, they will act sooner rather than later, which is why the key objective for most people should just be to not get shaken out in the meantime.”
And while investors are eagerly awaiting the first rate cut, it could be a case of ‘be careful what you wish for,’ as X user Brett noted that history shows rate cuts tend to be followed by notable decreases in stock prices, and there’s no reason to think that this time will be different.
“We are 15 days away from the first Fed rate cut of this cycle,” he tweeted. “Using that same time frame, I overlayed the following past rate cut cycles: 1981, 1990, 2000, and 2007.”

“These four cutting cycles matched the same data that we're seeing currently (unemployment rate curving up, 10y2y inversion, etc),” Brett said. “The sentiment from the Bulls is that rate cuts are suitable for the market. This is true...in the long run. History shows that the market pumps, on average, for 25 days after rate cuts, followed by an average of a 13-month sell-off.”
Mixed performance in the altcoin market
Altcoins traded mixed on Wednesday, with an even number of winners and losers in the top 200.
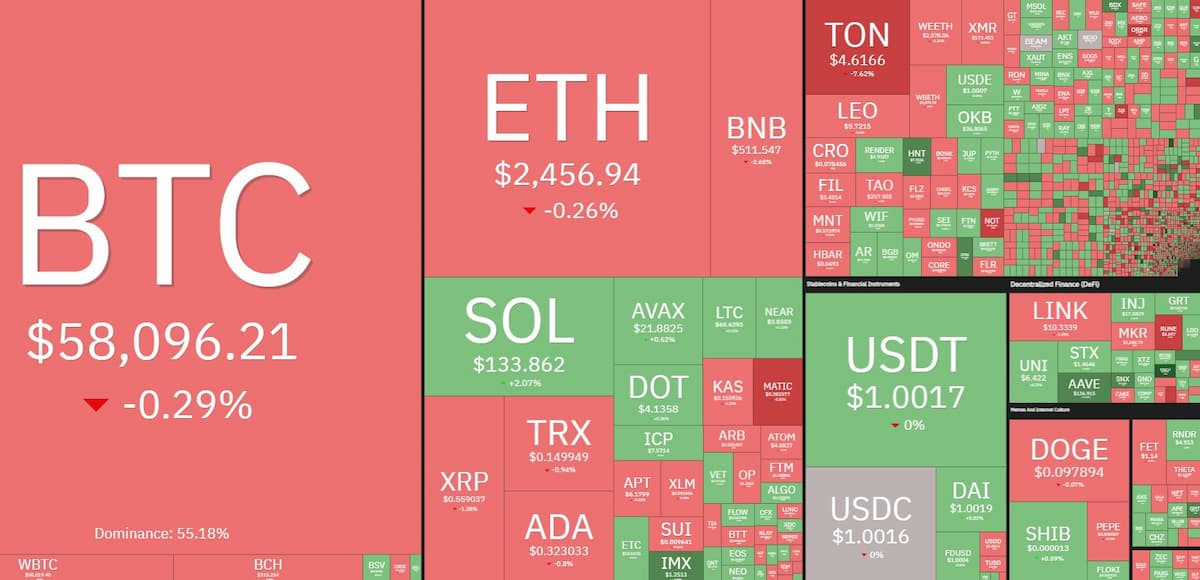
Daily cryptocurrency market performance. Source: Coin360
1inch Network (1INCH) led the field with a gain of 21.6%, followed by increases of 11.9% and 11.6% for Aave (AAVE) and GMT (GMT), respectively. Sun (SUN) fell 9.2% to lead the losers, while Flux (FLUX) lost 8.5% and Toncoin (TON) declined by 7.4%.
The overall cryptocurrency market cap now stands at $2.03 trillion, and Bitcoin’s dominance rate is 56.5%.
