

(Kitco News) – Financial markets ended the week on strong footing as stocks, gold, and Bitcoin (BTC) all trended higher, with the S&P besting its previous all-time high by a hair, while gold bulls stampeded their way above $2,700/oz for the first time in history.
“Looking at the macro picture, everything is still well within the Goldilocks zone: major U.S. equity indices are ripping to new ATHs, while new economic releases are taking away the last hopes of those that kept calling for a recession—not much of a recession when retail sales and the Philadelphia Fed Manufacturing Index are both beating (already good) estimates,” said markets analyst Bloodgood.
“As long as we don't see any unexpected escalations on the geopolitical plane, it looks more or less like smooth sailing (with the caveat that volatility can spike leading up to the elections),” he added.
Bloodgood noted, “While equities are doing great, Bitcoin might not be ripping to ATHs, but there's once again an insane amount of interest in the spot ETFs. Since last Friday, there has been a total of $2.1 billion in net inflows into ETF versions of the orange coin, and the data for today is yet to be released.”
Bloomberg senior ETF analyst Eric Balchunas noted that the surge in BTC ETF demand has pushed the total net flow above $20 billion, a feat that took gold ETFs about five years to accomplish, while Bitcoin did it in less than one.
Bitcoin ETFs have crossed $20b in total net flows (the most imp number, most difficult metric to grow in ETF world) for first time after huge week of $1.5b. For context, it took gold ETFs about 5yrs to reach same number. Total assets now $65b, also a high water mark. pic.twitter.com/edldEimfqd
— Eric Balchunas (@EricBalchunas) October 17, 2024
“This past week, Bitcoin ETFs attracted $470.5 million, predominantly through Blackrock, while Ethereum-focused funds, spearheaded by Fidelity, drew $48.4 million,” said analysts at Secure Digital Markets. “Notably, Bitcoin ETFs have surpassed $20 billion in total net flows for the first time, with a record $2.1 billion inflow over five consecutive sessions, absorbing about 48 days’ worth of mined supply, around 450 BTC daily. Total assets under management for Bitcoin now stand at $65 billion.”
Bloodgood highlighted the impact geopolitical risks are having on markets, saying, “In the event of further escalation in the Middle East—something that would spike the price of oil and shake up the U.S. economy—there are good reasons to believe that Bitcoin would fare much better than equities.”
“Money printing would only get shifted into an (even) higher gear in that case, and we know what that means for BTC,” he said.
This is also factoring into spot gold’s up-only rally and repeated all-time highs, with the yellow metal surging as high as $2,722/oz on Friday and trading at $2,720.60/oz at the time of writing for a gain of 1.04% on the session.
Another thing to keep an eye on is the DXY, Bloodgood noted. “The Dollar Index continues to show strength and peeked above the major 103 level. Clearing this level is an important move and could negatively impact risk-on assets, but let’s wait and see what happens next week.”
At the closing bell, the S&P, Dow, and Nasdaq all recorded gains, finishing up 0.40%, 0.09%, and 0.63%, respectively.
Data provided by TradingView shows that Bitcoin bulls leveraged support at $67,000 to slingshot higher, rallying to $69,000 for the first time since late July and looking poised to make a run at bearish resistance at $70,000.
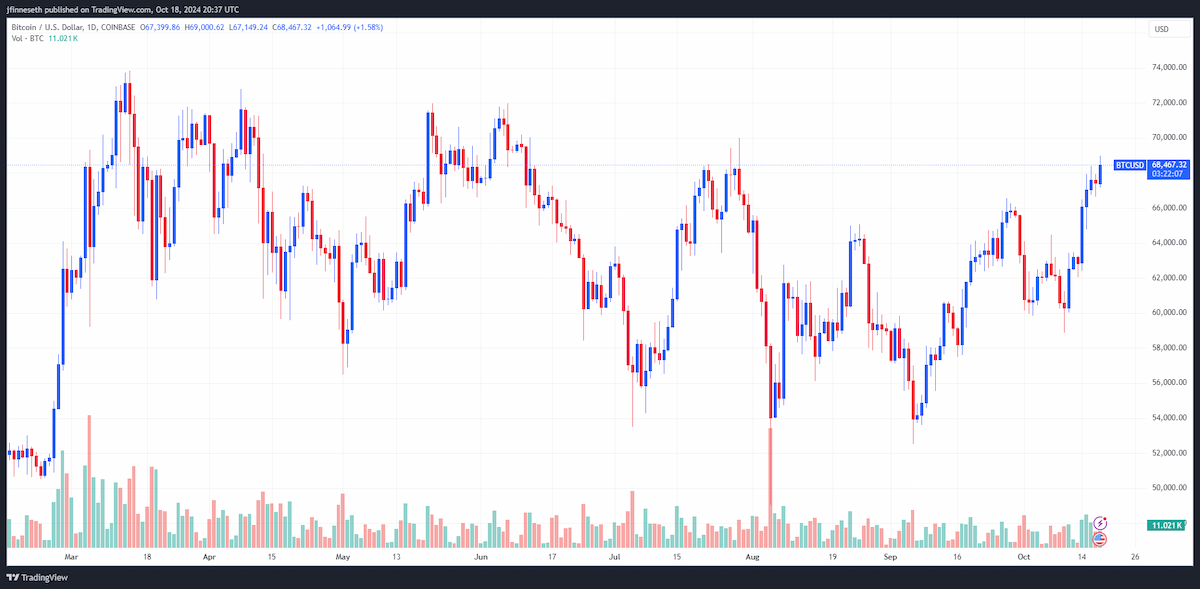
BTC/USD Chart by TradingView
At the time of writing, Bitcoin is trading at $68,538, a gain of 2.30% on the 24-hour chart.
The next phase of the bull cycle is underway
“Last week, BTC traded slightly above the support area, which was tested soon after the previous issue was published,” Bloodgood said. “A test on the daily timeframe triggered quite the reaction, which in the next couple of days led to a breakout above the infamous daily resistance at ~$64.6k.”
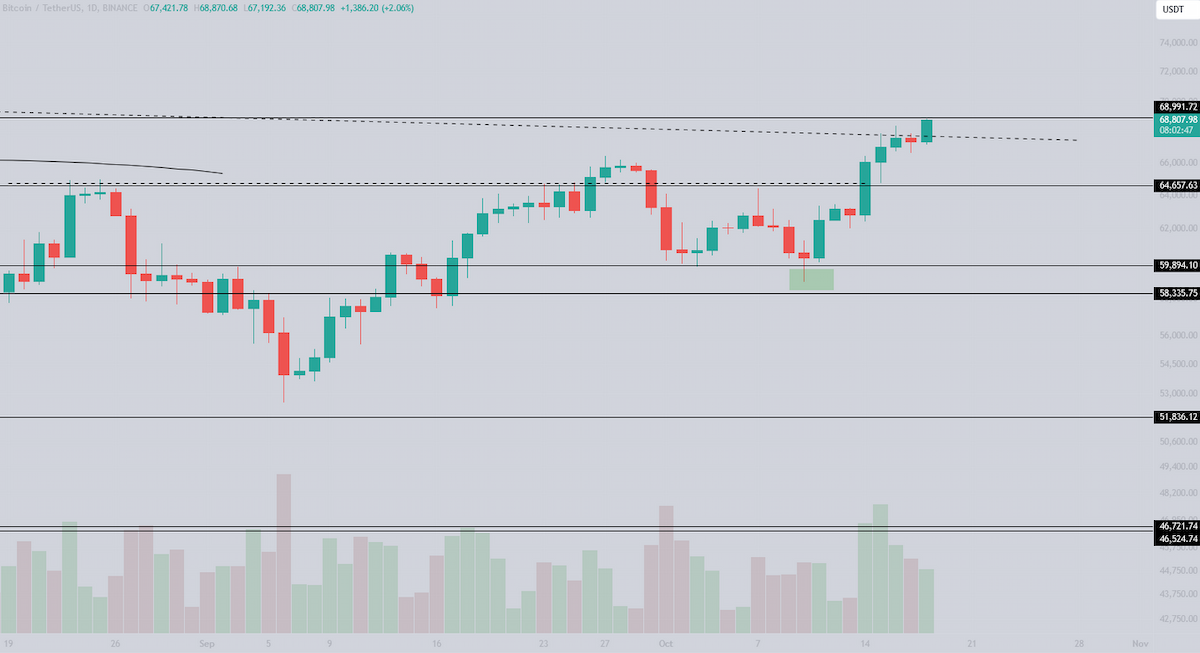
“More importantly, as I mentioned last week, we are seeing bullish momentum in the bigger picture, and this week we have confirmation, as a higher high was once again printed on the weekly timeframe,” he added.
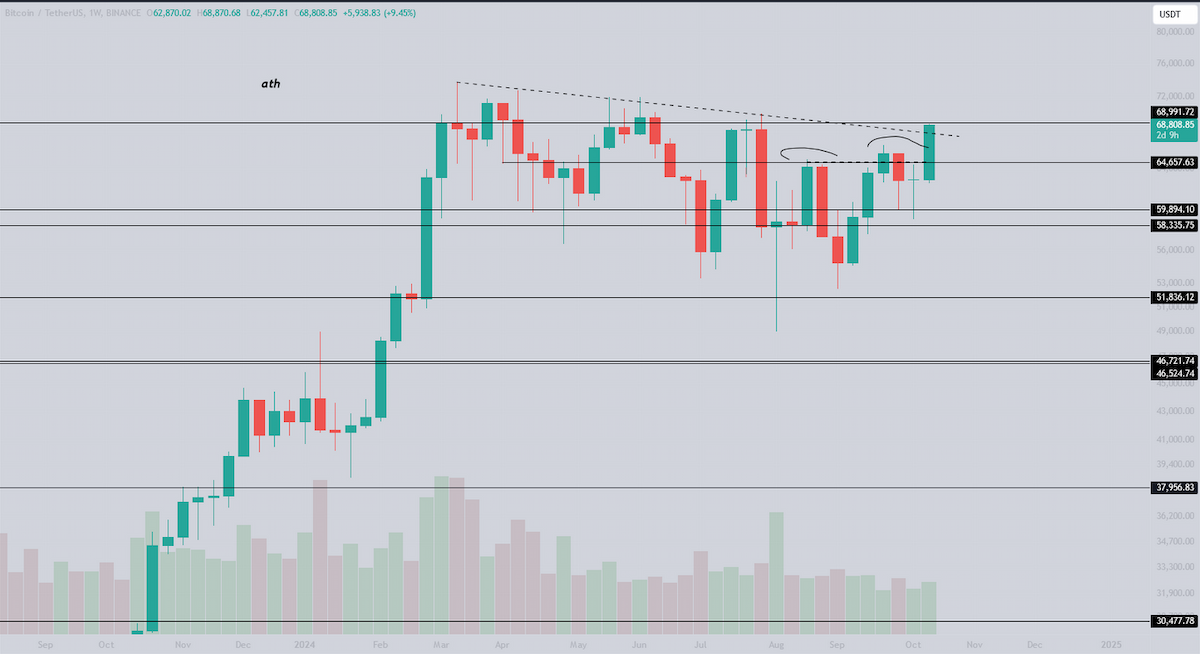
“At the time of writing, bulls are fighting to break above the long-lasting downtrend line, which is part of a huge weekly bull flag,” Bloodgood said. “A confirmed breakout from this channel could lead to a major leg up. Stay glued to the chart—the party is just starting.”
According to TradingView analyst Alan Santana, while most market watchers are focused on Bitcoin breaking out above $70,000, the better play will be found in the altcoin market.
“Bitcoin is about to enter bullish territory,” he said. “If we get a move and close above the $70,000-$71,000 price range, Bitcoin [will officially be] in bullish territory as the lower highs chart structure breaks down. (A break above 70,000 would produce the first higher high.)”
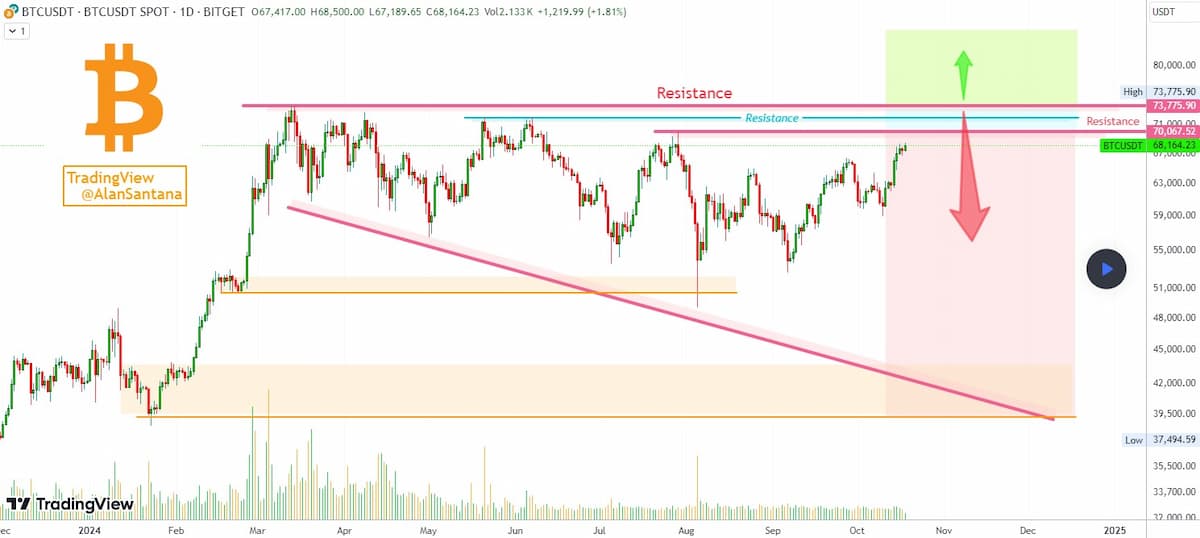
“At this point, if it happens, we do not LONG Bitcoin. Instead, we focus on the Altcoins and those pairs/projects that are trading low/near support,” Santana said. “If Bitcoin moves and closes above $70-$71,000, the doors are open for additional growth, but we would only enter at support after a correction.”
“As long as Bitcoin remains below $74,000, [a] strong possibility remains for a sudden crash, but after breaking 70/71,000, the lower low scenario becomes less likely,” he added. “The only thing that would change for our map in the case of a bullish break of resistance is the removal of the lower low scenario (this is positive).”
“I repeat, we do not LONG Bitcoin at resistance (here), but instead focus on those pairs/projects that are trading really low and near resistance,” he reiterated. “These will offer a much better risk/reward ratio.”
“If Bitcoin moves above resistance, the fact will remain that it has been rising for more than 75 days, and a correction can happen anytime,” he warned. “We do not buy at resistance but at support. Our entry would be only when a support level is activated. Currently, Bitcoin is trading below the mentioned levels, and thus, the lower-low scenario remains valid based on technical analysis.”
As for what to expect when a break higher does occur, TradingView analyst TradingShot looked to Bitcoin’s past to help predict its future, noting, “BTC's Cycle peaks in historical order have been $32, $1250, $19800, $69800. They all made contact with the Logarithmic top Growth Curve, a historic pattern that [has held] since BTC's inception.”
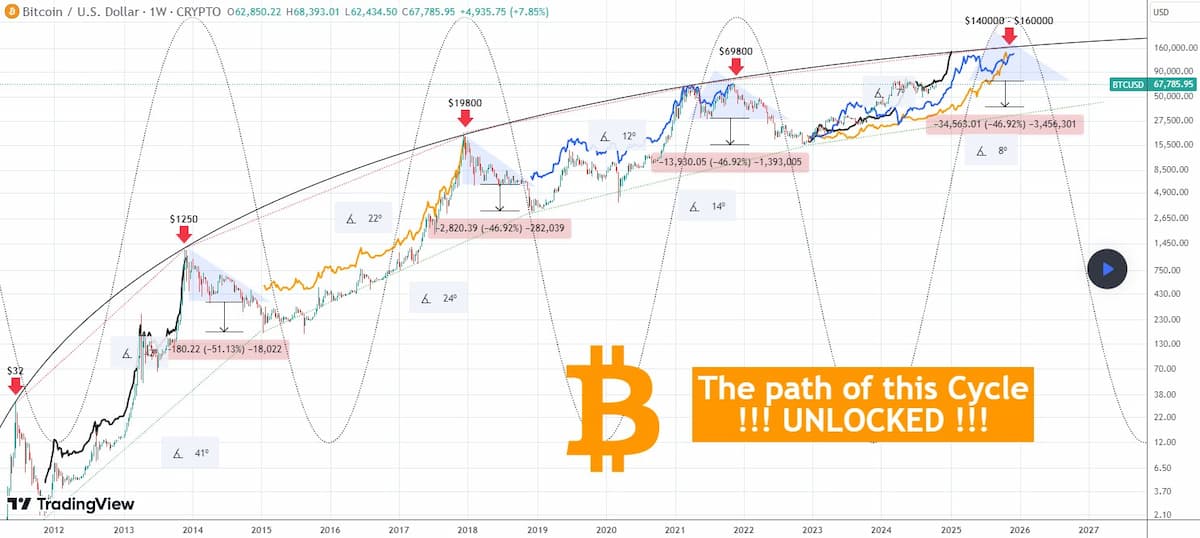
“Every peak-to-peak measurement appears to be roughly half of the previous peak,” TradingShow observed. “The automatic angle measurements on the (red) dotted lines may differ based on the screen's display and how the horizontal/vertical axis moves, but ours goes like this: 42°, 22°, 11°. We estimate a 7° angle for the new Cycle peak on the log Growth Curve.”
“If we take all previous Cycles and apply them to fit the new price action towards the top of the Log Growth Curve, that 7° line gives a projected Cycle peak within $140000 - 160000 (slightly updated from our study a year ago),” he said.
“It is also interesting to apply the same angle principle to the Cycle bottoms,” TradingShot noted. “We can see that those (green dotted lines) can also roughly be half of what the previous bottom was (though the variations are higher). The new bottom is estimated to be on an 8° angle.”
“Remarkably, the angles of the tops and bottoms of each Cycle have approximately the same measurements, indicating that despite being logarithmic within a curve, they can be viewed separately in Channels,” he added.
Looking at previous cycles compared to the current price chart, TradingShot observed that this “Cycle was much more aggressive than the previous two (blue and orange) due to mainly the Bitcoin ETF launch, and is certainly more similar to the first Cycle (black).”
“That suggests that it will top by January 2025, but the Sine Waves Tops, which have caught Bitcoin's cyclical peaks with incredible accuracy, indicate it will be around November 2025,” he said. “As you can see, this is exactly where the projection of the blue and orange fractals show.”
Bullish momentum propels altcoins higher
As highlighted by Santana, altcoins often see larger rallies when Bitcoin goes on a run, and that was evident on Friday as a dozen tokens in the top 200 recorded double-digit gains, while only one token recorded a loss of more than 0.50%.
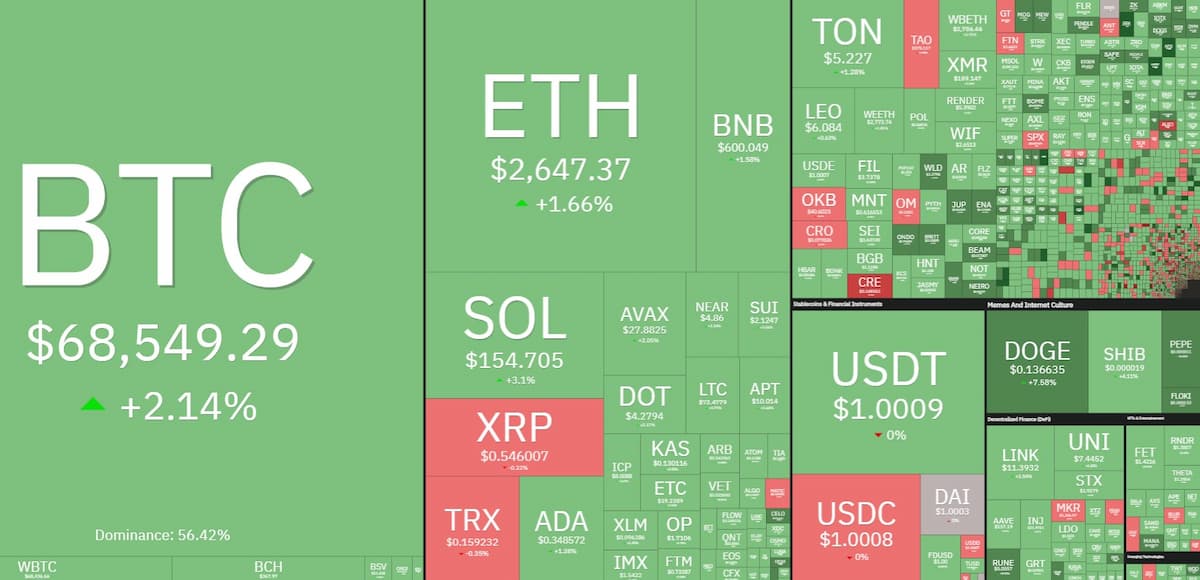
Daily cryptocurrency market performance. Source: Coin360
Ondo (ONDO), Worldcoin (WLD), and EigenLayer (EIGEN) led the field with gains of 13%, followed by 12.6% increases for Baby Doge Coin (BabyDoge) and Metis (METIS). Notably, the most recognizable meme coin – Dogecoin (DOGE) – benefitted from Elon Musk's discussion of his proposed “Department of Government Efficiency” (D.O.G.E) at a recent Pennsylvania town hall, and its 12% rally on Friday lifted it to $0.134 for the first time since July. Scroll was the odd coin out to end the week, recording a loss of 2.2%.
The overall cryptocurrency market cap now stands at $2.35 trillion, and Bitcoin’s dominance rate is 57.8%.
