Even at close to $100 an ounce today, silver is still a must-buy. Here is why:
1. Silver vs The Quantity of US Dollars
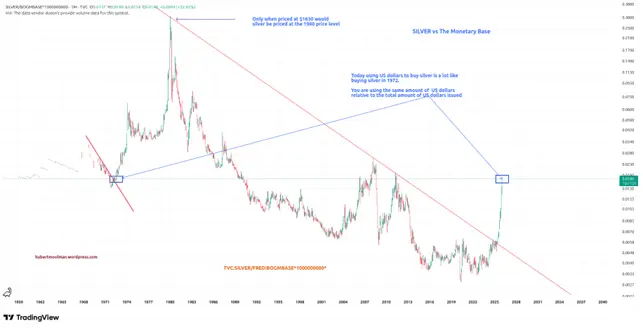
Buying silver today with US dollars is a lot like buying silver in 1972. Below, is a chart that shows the silver price relative to the monetary base (currency in circulation plus reserve balances):
 When buying an ounce of silver today, you are using the same amount of US dollars relative to the total amount issued (according to the FED) as you would have circa 1972.
Only at around $1630 per ounce (today) would silver be priced at the 1980 high, relative to total US dollars issued.
2. Silver vs Dow
Since the creation of the Federal Reserve, the Dow Jones has significantly outperformed silver.
It was only during brief periods before the 1919 and 1980 silver peaks that silver was able to outperform the Dow (see the Dow/Silver chart below).
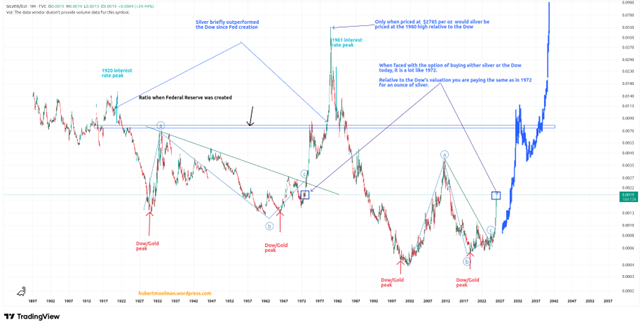
The Dow/Silver ratio needs to rise above the double blue line in order to reach parity with the Dow since the creation of the Federal Reserve. In current prices, that would mean silver’s price needs to be way above $300.
Note that the FED, by way of its money creation, first benefits the stock market, and then only at the end of that cycle do assets like silver and gold catch up and ultimately outperform (more detail here).
We are now in that catch-up phase. Relative to the Dow, silver is still historically very cheap. When faced with the option of buying either silver or the Dow today, it is a lot like 1972. Relative to the Dow’s valuation, you are paying the same as in 1972 for an ounce of silver.
Only when priced at $2785 per ounce would silver be priced at the 1980 high in terms of the Dow.
3. Still relatively early in this bull market
The current setup on the silver chart is a lot like the start of the silver bull market of the early 2000s. In those days silver was under $6 and considered cheap.
The current bottoming pattern from around 2014 to now is very similar to the early 2000s bottoming pattern (see the chart below).
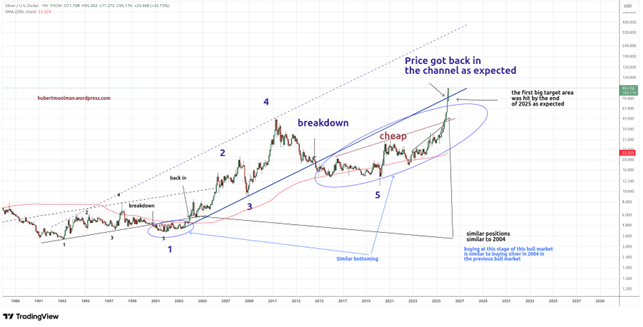
Find more detail on the chart here. I have indicated how the current chart position is similar to circa 2004, when prices were still around $6. 2004 was still very early in the bull market, an excellent time to buy. Buying at the current levels (given the above) presents equally great value.
More on these charts and this kind of analysis at my premium gold and silver blog or my Silver Long-term Fractal Analysis Report.
Warm regards
And that, knowing the time, that now it is high time to awake out of sleep: for now is our salvation nearer than when we believed.