
Live Market Prices
Track live prices across precious metals, base metals, cryptocurrencies, and market indicators in one place.
ET
Precious Metals
Spot market closedView all »
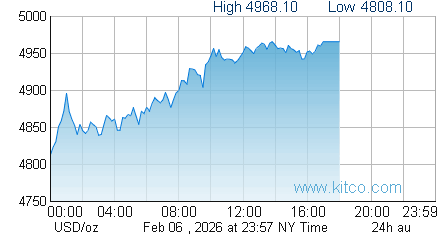
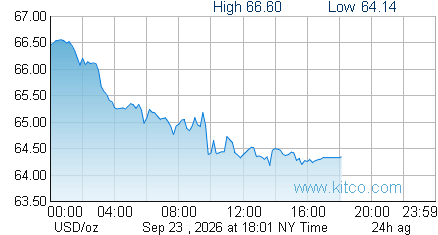
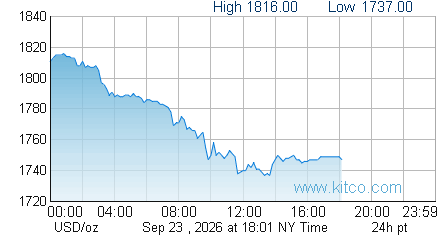
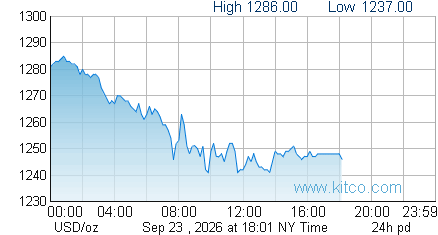
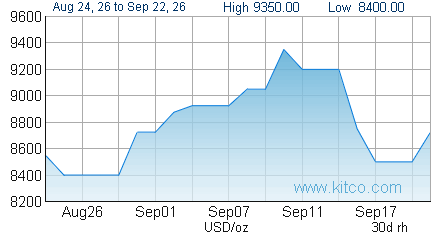
Base Metals
Spot market closedView all »
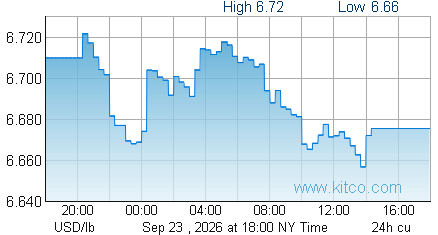
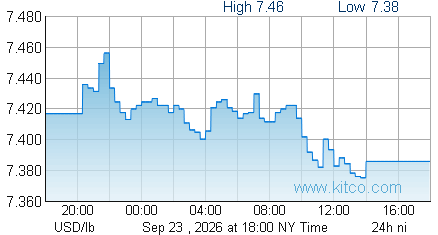
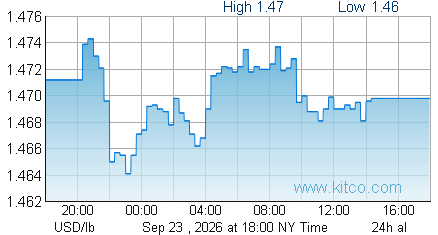
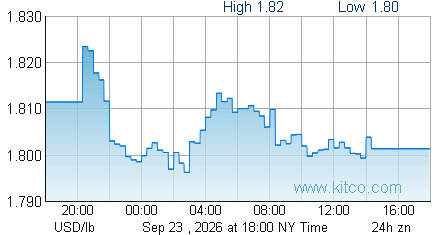
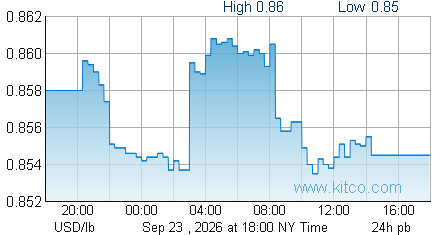
Cryptocurrencies
Trading 24/7View all »





Gold Indicators
Markets closedView all »
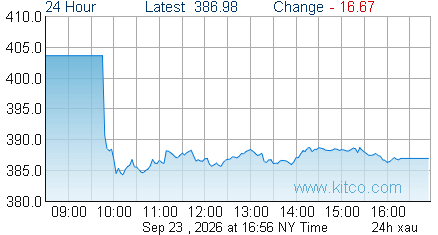
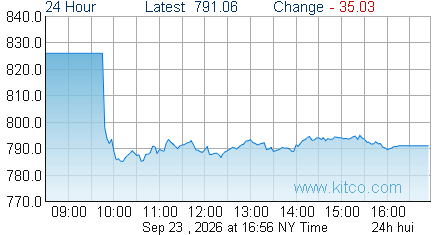
Value Calculator | Exchanges | |||||
|---|---|---|---|---|---|---|
| Currency | X = 1 USD | Change % | X USD = 1 | Price / oz | Change | Change % |
 USD11/21 - 23:50:00 | — | — | — | $3,537.90 | -86.30 | ▼ 2.38% |
 CAD11/21 - 23:50:00 | 1.4346 | 0.00% | 0.6970 | C$5,075.65 | -123.81 | ▼ 2.38% |
 AUD11/21 - 23:50:00 | 1.5109 | 0.00% | 0.6619 | A$5,345.24 | -130.39 | ▼ 2.38% |
 EUR11/21 - 23:50:00 | 0.9121 | 0.00% | 1.0964 | €3,226.74 | -78.71 | ▼ 2.38% |
 GBP11/21 - 23:50:00 | 0.7643 | 0.00% | 1.3083 | £2,704.19 | -65.96 | ▼ 2.38% |
 JPY11/21 - 23:50:00 | 158.5390 | 0.00% | 0.0063 | ¥560,895.13 | -13,681.92 | ▼ 2.38% |
 CHF11/21 - 23:51:00 | 0.8401 | 0.00% | 1.1903 | 2,972.37 | -72.50 | ▼ 2.38% |
 CNY11/21 - 23:50:00 | 6.6748 | 0.00% | 0.1498 | ¥23,614.77 | -576.04 | ▼ 2.38% |
 HKD11/21 - 23:51:00 | 7.8628 | 0.00% | 0.1272 | HK$27,817.80 | -678.56 | ▼ 2.38% |
 BRL11/21 - 23:51:00 | 5.9480 | 0.00% | 0.1681 | R$21,043.43 | -513.31 | ▼ 2.38% |
 INR11/21 - 23:50:00 | 92.6304 | 0.00% | 0.0108 | ₹327,717.27 | -7,994.01 | ▼ 2.38% |
 MXN11/21 - 23:51:00 | 19.1590 | 0.00% | 0.0522 | $67,782.63 | -1,653.42 | ▼ 2.38% |
 ZAR11/21 - 23:50:00 | 17.5982 | 0.00% | 0.0568 | R62,260.67 | -1,518.72 | ▼ 2.38% |
Edit the quantity to use this as a value calculator.
Frequently Asked Questions
- What can I track on the Kitco live market prices page?
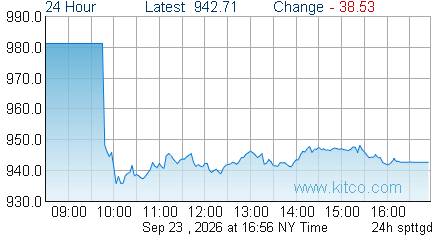
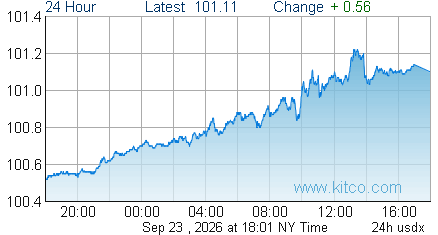
- This hub brings together live prices across precious metals (gold, silver, platinum, palladium, rhodium), base metals (copper, nickel, aluminum, zinc, lead), major cryptocurrencies, and gold-market indicators such as the US Dollar Index and the gold/silver ratio — all on one page with bid, ask, daily change and the day's range.
- Can I see prices in different currencies and units?
- Yes. Switch the whole page between major currencies, and switch metal units between ounce, gram and kilo. The selection applies across every section.
- How do I calculate the value of a quantity of metal?
- Use the value calculator: choose a metal, enter a quantity in ounces, grams, kilos, pennyweight or tola, and the value is shown across major world currencies at live spot rates.
- Where are the dedicated gold and silver pages?
- Each section links to its dedicated pages: gold and silver open Kitco's full charts pages, and every precious metal, base metal and cryptocurrency has its own detail page reachable from the section's links.