

Bitcoin Technical Analysis
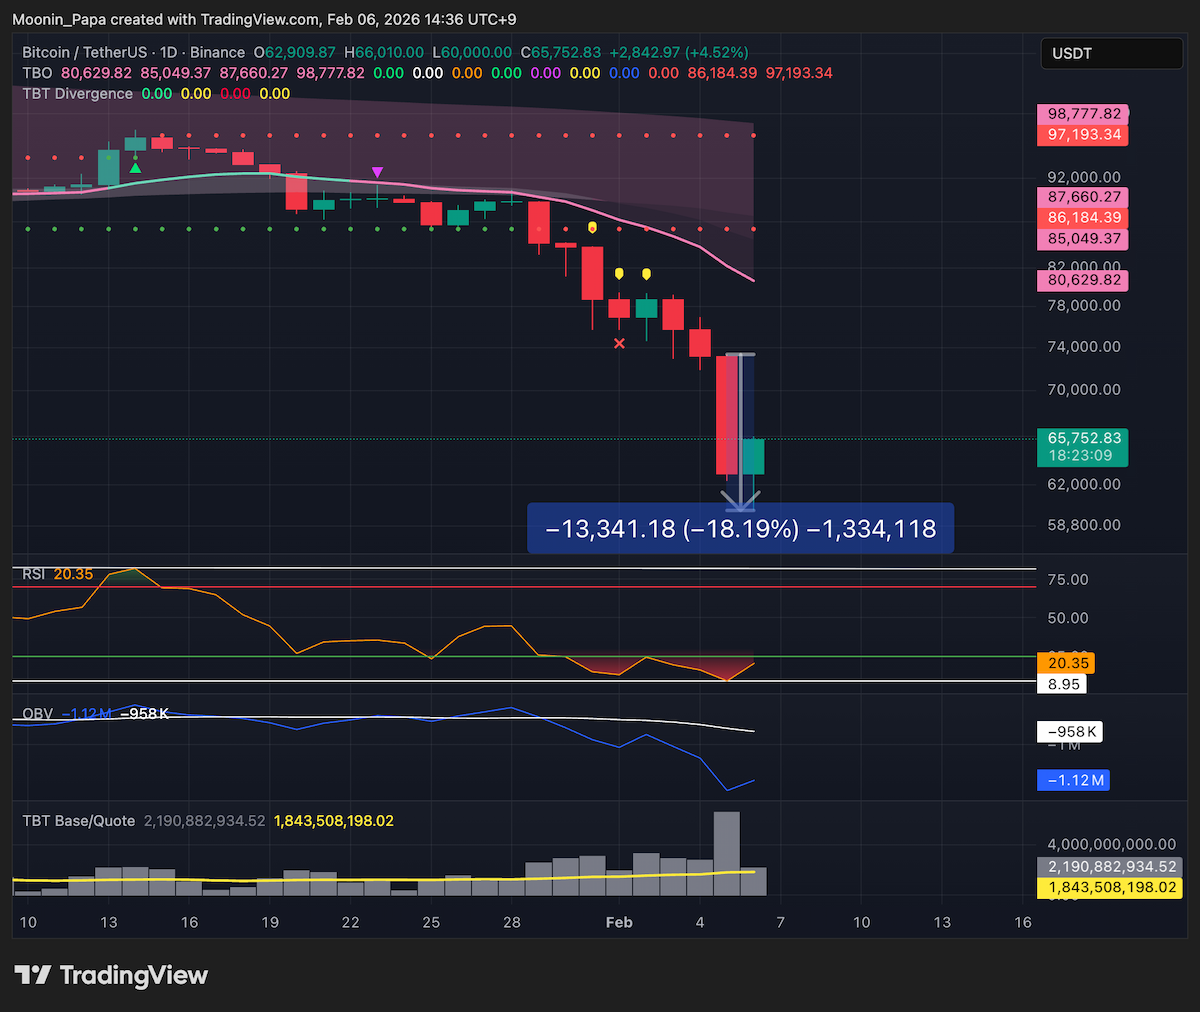
After a historic one-day drop to $60,000, Bitcoin recorded its lowest daily RSI since August 2023, closing at 8.95 on a heavy 14% red candle. The third consecutive TBO breakdown on the daily chart precipitated a 24% wick-to-wick decline, with $6.6 billion in volume—over three times the average. While today's 4.8% rebound off $60,000 suggests oversold relief, this dead cat bounce is unlikely to produce a V-shaped recovery.
On the weekly chart, Bitcoin is set to close below the TBO Cloud in strong bearish mode, with weekly RSI at 16.26 and trending lower. Historical parallels in mid-2022 and March 2020 indicate that extreme oversold weekly RSI readings tend to precede further downside rather than immediate rallies.
Ethereum Performance and Outlook
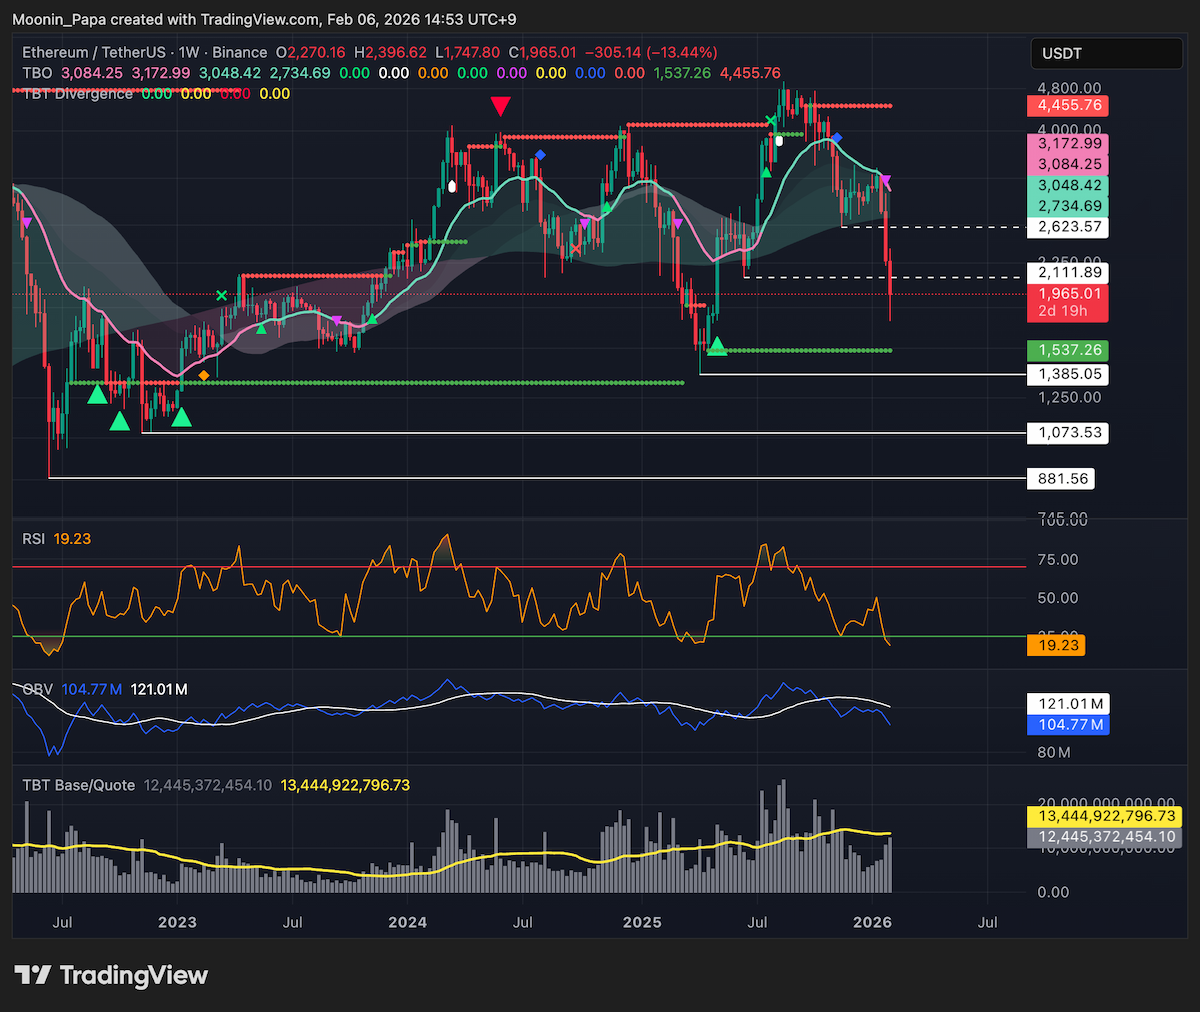
Ethereum dropped 15% in one day, pushing its daily RSI to 11.49 and validating the earlier TBO breakdowns. On-balance volume (OBV) and its moving average continue to decline, reinforcing bearish momentum. Weekly charts mirror Bitcoin, with ETH price action, TBO patterns, and weekly RSI all signaling further downside risk.
Daily time frame comparisons to June 2022 and tariff-related FUD events support expectations of continued depreciation before any meaningful recovery.

Market Dominance Shifts

Combined stablecoin dominance surged to 12.5%, with daily RSI climbing to 91.63—marking a second TBO breakout on the weekly and suggesting further gains toward a potential 18% peak by bear-market end. Conversely, Bitcoin dominance fell 1.64%, breaking short-term support after recent TBO close-long signals.
OTHERS.D remains in “strong bullish” mode only due to relative outperformance versus BTC, but a renewed leg lower is likely once the dead cat bounce unwinds. Totales.d dominance dropped over 2%, with weekly RSI at 11.12—levels which in May 2022 preceded deeper declines.
TradFi Correlations and Risks
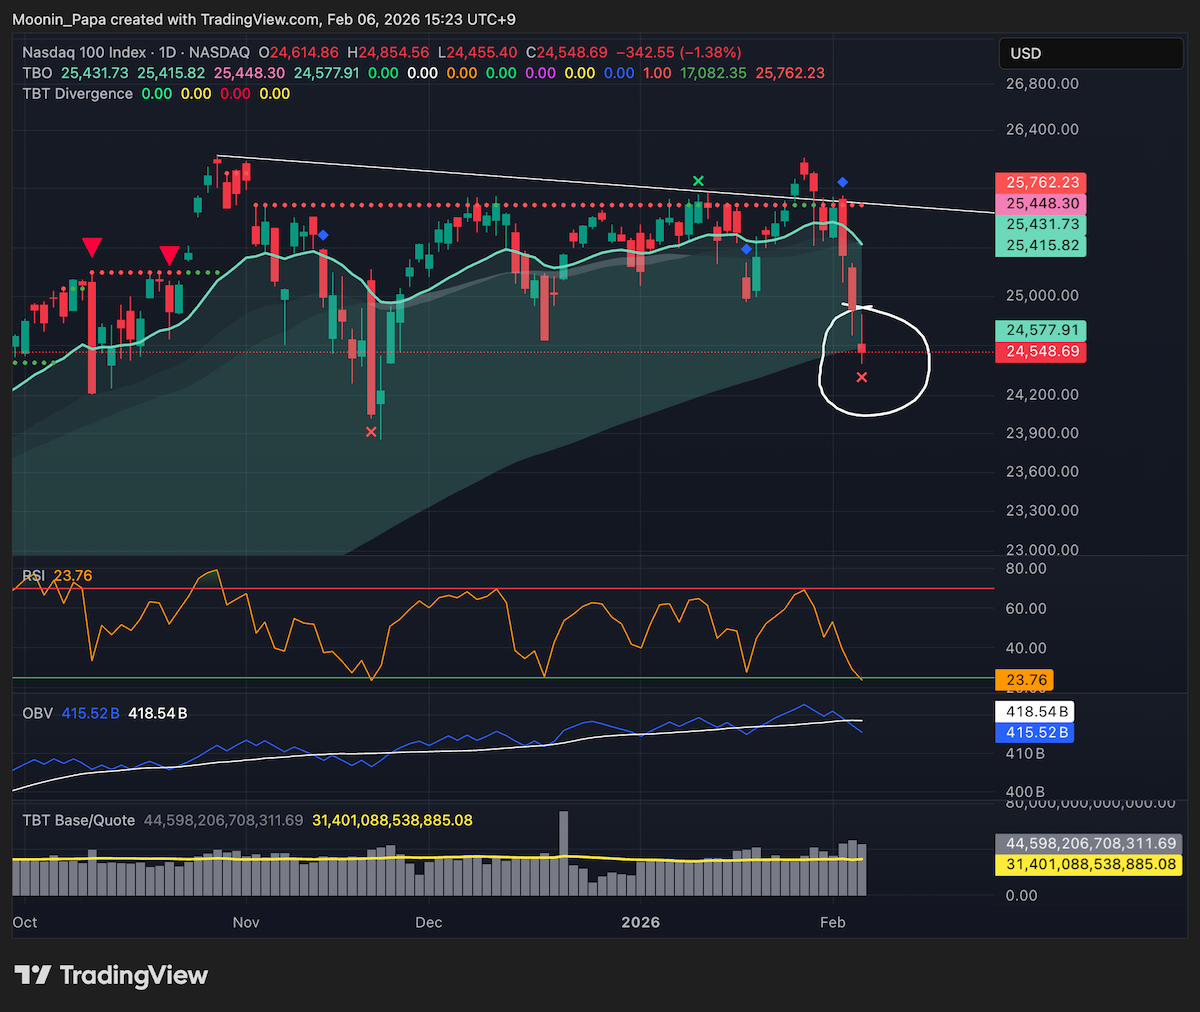
U.S. equities plunged further into bearish territory: the S&P 500 closed below its daily TBO Cloud, weekly OBV is trending lower, and the Dow Jones confirmed a fourth 4-hour bearish divergence cluster in two weeks. The Nasdaq traded under its daily cloud, while FANG and Nvidia charts exhibit TBO breakdowns and strong bearish mode. The VIX spiked into its rejection zone above 22.
Given these indicators, a sustained downturn in TradFi could exert additional downward pressure on crypto markets, negating any short-lived bullish retracements.
Commodities and Crypto Pairs
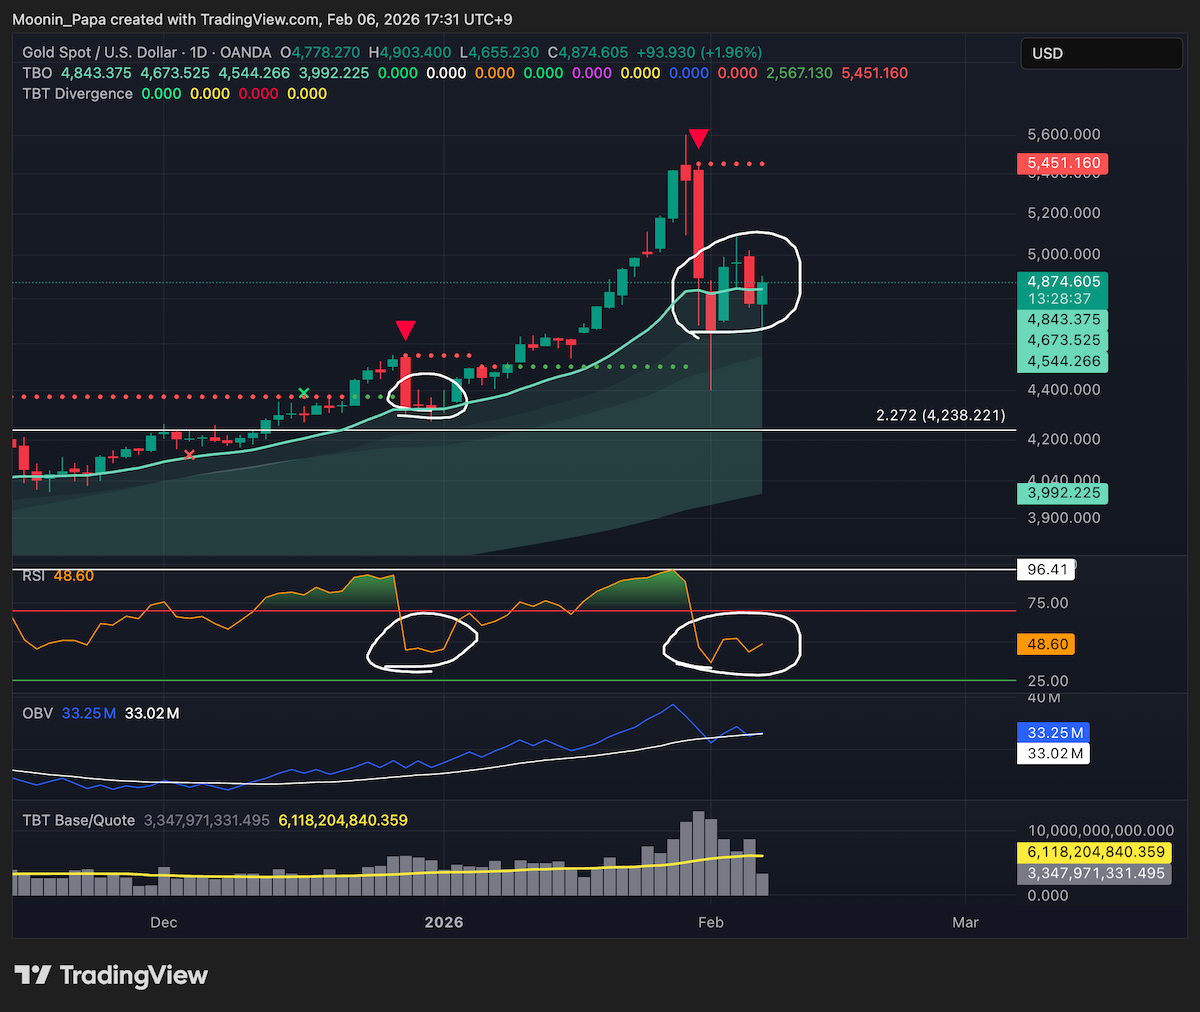
Gold continues to consolidate near its daily TBO Fast line with OBV trending upward—targeting $6,500 in the coming months. Silver’s 20% one-day decline and two daily TBO close-longs suggest sideways action for 1–2 months, while weekly charts retain bearish divergence.
Uranium entered bearish consolidation as daily and weekly RSI trends align with declining prices. PAXG/BTC has been parabolic since October but may retrace toward the 0.786 Fibonacci level or historical TBO resistance at 0.108 BTC if Bitcoin resumes its decline.
Altcoin Landscape
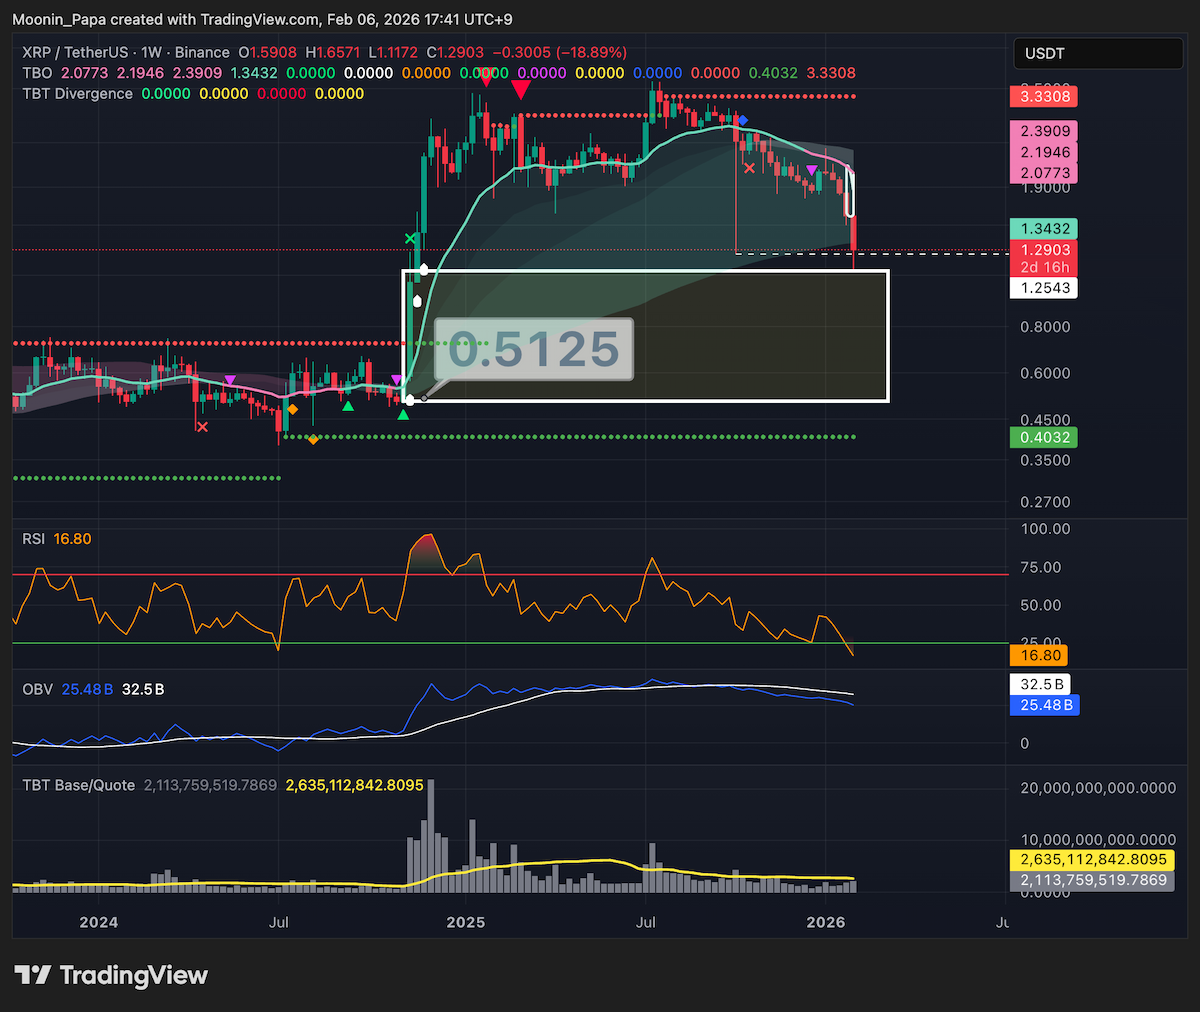
Key altcoins are under pressure: BNB tests historical TBO support at $615 and remains oversold; XRP closed below its October low with no support until $0.50 and is in weekly bearish mode; SOL faces a fair-value gap target near $22; TRX confirmed its first TBO breakdown; BCH lost support at 258; and LINK returned to its October low. Most altcoins risk further downside as the dead cat bounce unwinds.
Learn my strategies and the tools I use every day by visiting The Complete Cryptocurrency Investor by Mastering Assets.