

Bitcoin and Ethereum accelerated on Tuesday, but the strongest candles also produced the signals that define the next decision points. Bitcoin still has room before RSI becomes overbought, while Ethereum dominance has reached a much more stretched condition. The result is a constructive near-term setup with clear reasons not to chase the move.
Bitcoin can pull back before another push toward $70,000
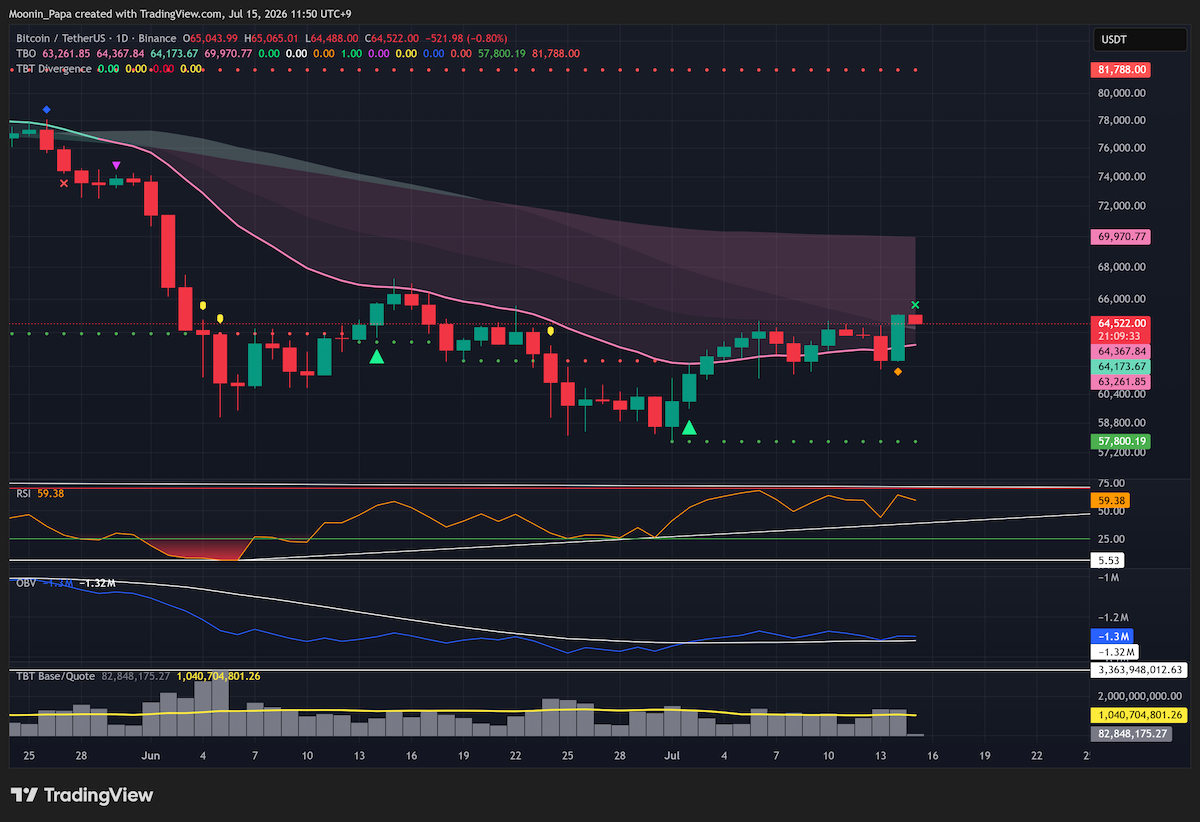
Bitcoin daily chart after Tuesday pump and TBO Close Short
Bitcoin gained 4% on Tuesday and printed a TBO Close Short. Daily RSI did not become overbought, leaving room for another advance, but the Close Short creates an expectation for a smaller pullback to the Fast line first. After that reset, the next cited objective is the Slow line near $70,000, described as a 19% target.
The calendar still matters. With July at its midpoint, bullish bounce euphoria should not override the historically bearish August and September window identified in the analysis.
Ethereum strength has reached its dominance warning
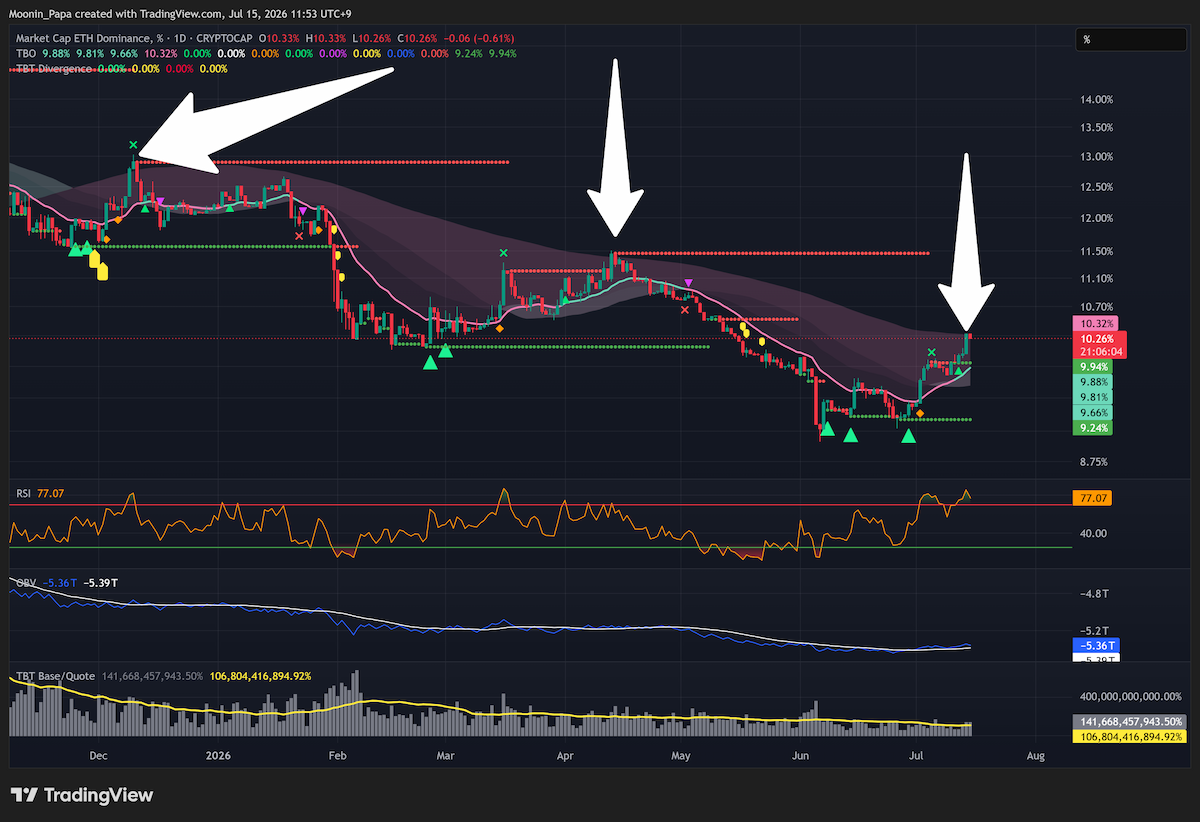
Ethereum dominance at the top of its daily Cloud with overbought RSI
ETH rallied more than 6% to $1,896, and the price can still move closer to $2,000. ETH.D is a separate chart measuring Ethereum dominance, not the ETH price. It tagged the top of its daily Cloud while its RSI reached 85.73. The previous two occurrences marked a point to take profits and begin preparing for a short rather than assuming the rally had become permanent.

Falling stablecoin dominance supports the current risk-on phase
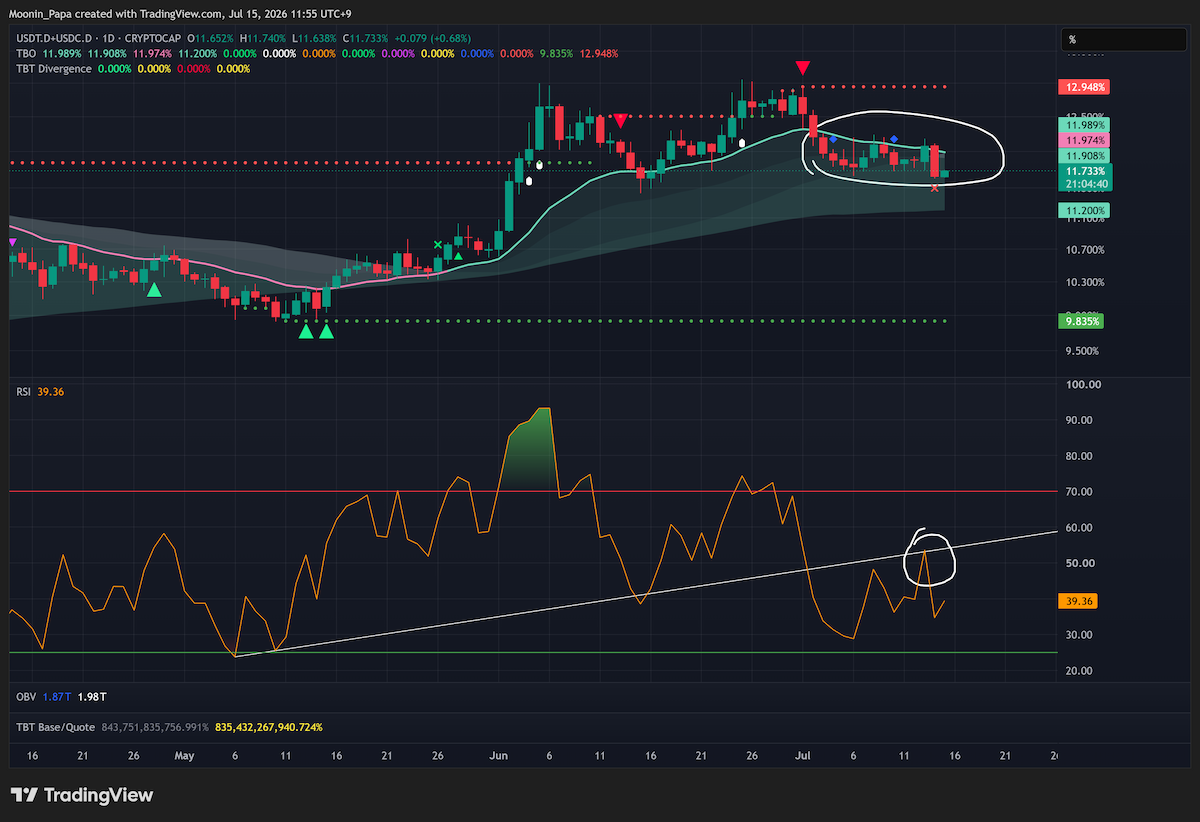
Combined stablecoin dominance after Tuesday decline
Combined stablecoin dominance dropped about 3.5% as crypto rallied. Its daily RSI respected former support as resistance, increasing confidence in a continued move toward oversold territory below 25 before month-end. That supports additional risk-on momentum, but it also describes a late-July phase rather than an open-ended trend.
The DXY reversal signal creates a potential macro tailwind
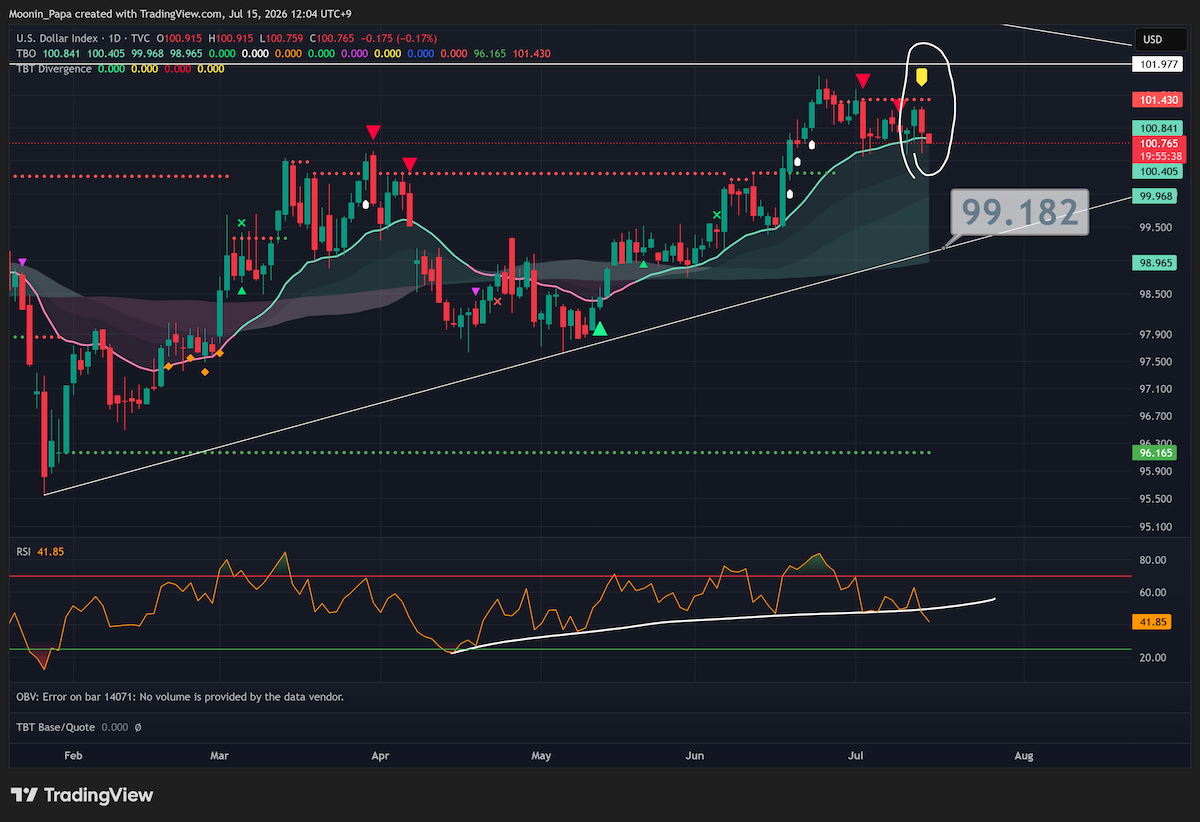
DXY with TBT Bearish Divergence Cluster and lost support
The DXY printed a TBT Bearish Divergence Cluster and lost its support line. A pullback toward 99 would be supportive for stocks, foreign exchange pairs, and crypto. The signal is not a complete macro trend reversal yet because the DXY Slow line is still curling upward, indicating that the larger dollar trend remains bullish.
Market breadth is improving before low-cap inflows arrive
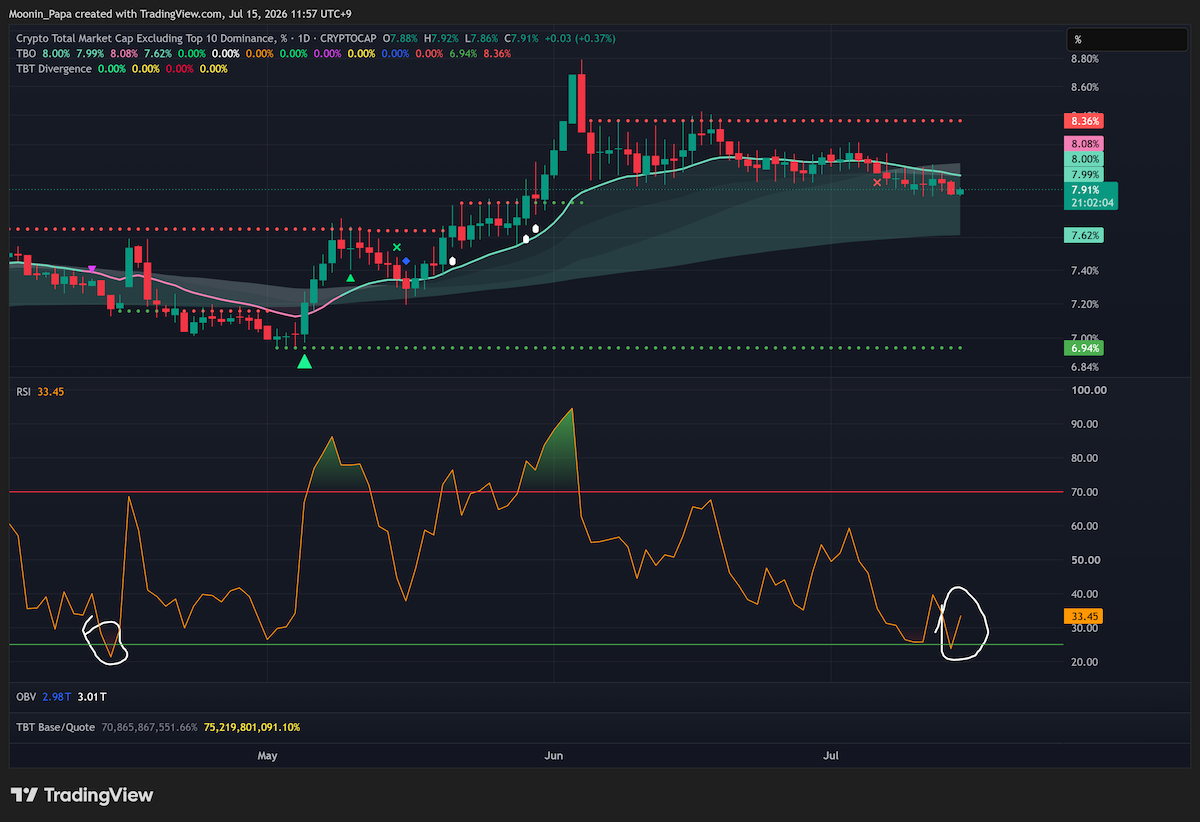
OTHERS dominance with its first bullish RSI Reset since April
OTHERS.D printed its first bullish RSI Reset since April, a constructive reversal signal, while TOTALES.D advanced without becoming overbought. TOTALES also printed a TBO Close Short and retained supportive RSI and on-balance-volume conditions. TOTALE100 has not yet shown the same inflow, indicating that capital has not fully trickled down to low caps.
Altcoin strength remains selective and divergence matters
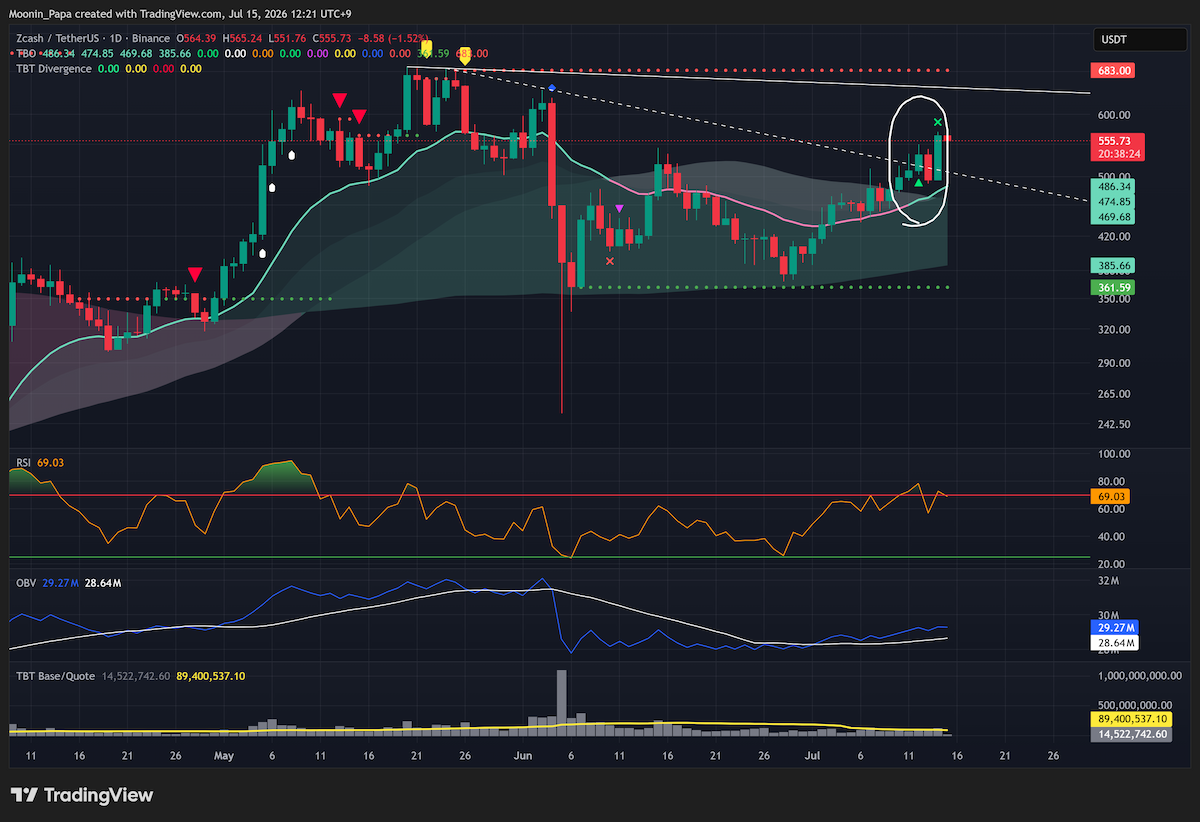
ZEC after a 13 percent rise with bearish RSI divergence
ZEC rose 13% and made a higher high while RSI made a lower high, creating bearish divergence despite the chart remaining strong bullish. SOL price rose about 3%, but SOL.D is its separate dominance chart and remained weak; the two should not be conflated. Elsewhere, XMR, PEPE, ENA, VIRTUAL and other ALTs printed short-term signals that require chart-by-chart selectivity instead of broad chasing.
Learn my strategies and the tools I use every day by visiting The Complete Cryptocurrency Investor by Mastering Assets.
