

My August 26 read keeps several mixed states intact: Bitcoin has bearish-divergence evidence but no solid reversal yet, Ethereum remains structurally powerful, stablecoin dominance is strongly bearish with bounce risk, lower-cap rotation is early and TradFi is mostly quiet.
Bitcoin is approaching $81,788 resistance
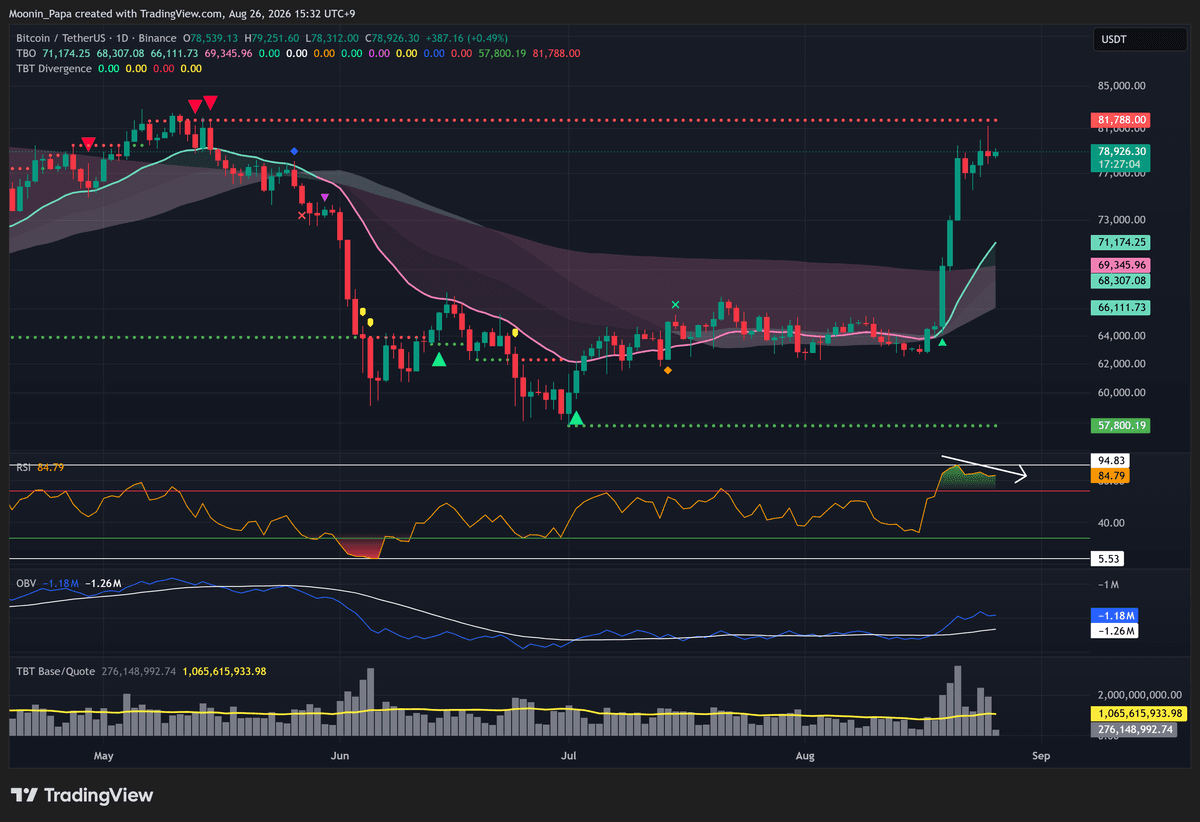
Bitcoin daily chart
I see BTC rising toward $81,788 TBO Resistance while RSI makes lower highs and volume falls. Those are clear bearish-reversal signs, but one 4h TBT Bearish Divergence is not enough to build a solid reversal argument, and I am not saying an immediate dump has begun. Near historical resistance, a short-term pullback makes sense. Even so, I think the bottom is most likely in; if BTC blasts through resistance, that is the last straw against my bearish bias.
Ethereum is above resistance while weekly structure stays powerful
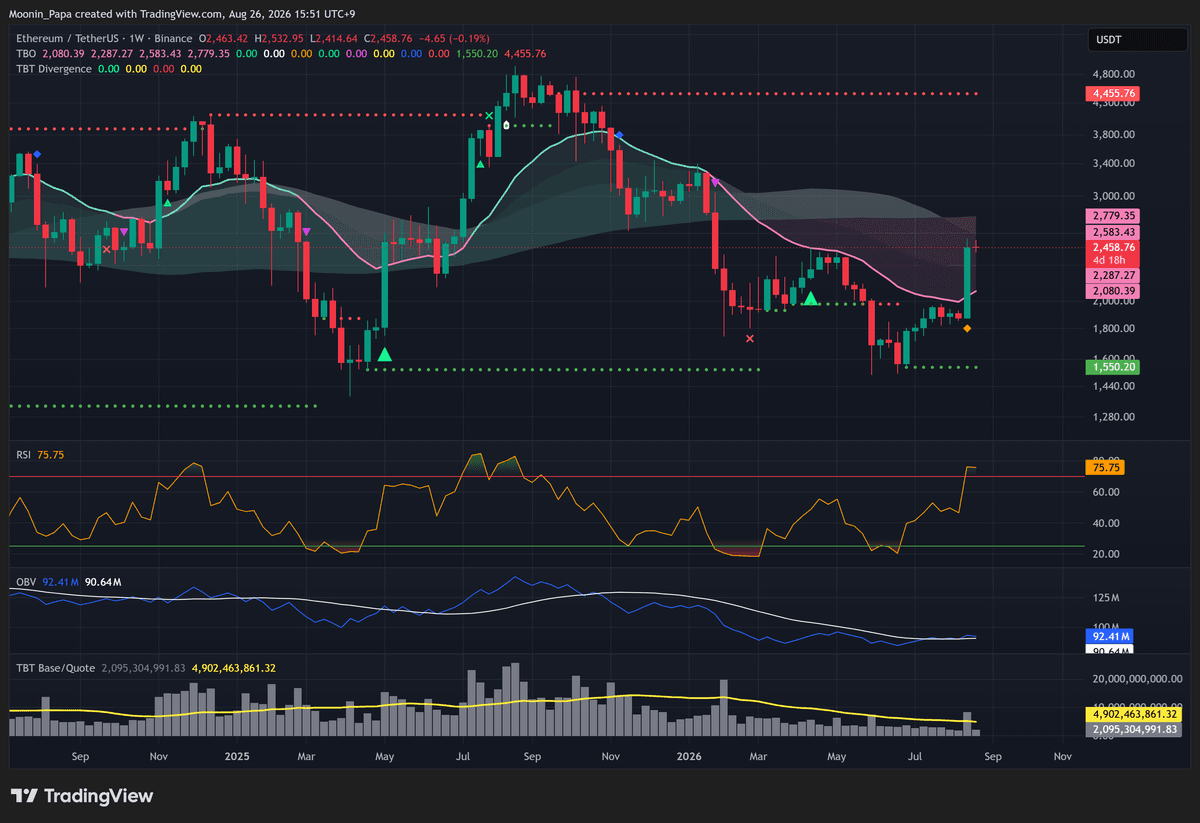
Ethereum weekly chart
I see ETH already above its 2025-2026 resistance cluster, even while the 2022 0.618 retracement remains resistance. ETH also printed one 4h TBT Bearish Divergence, but its weekly chart is crazy bullish and hard to deny. Last week's weekly TBO Close Short says a pullback to the Fast line is due, although an immediate move this week would be very weird. I preserve that tension rather than turning one divergence into a confirmed reversal.
Stablecoin dominance is bearish with bounce risk
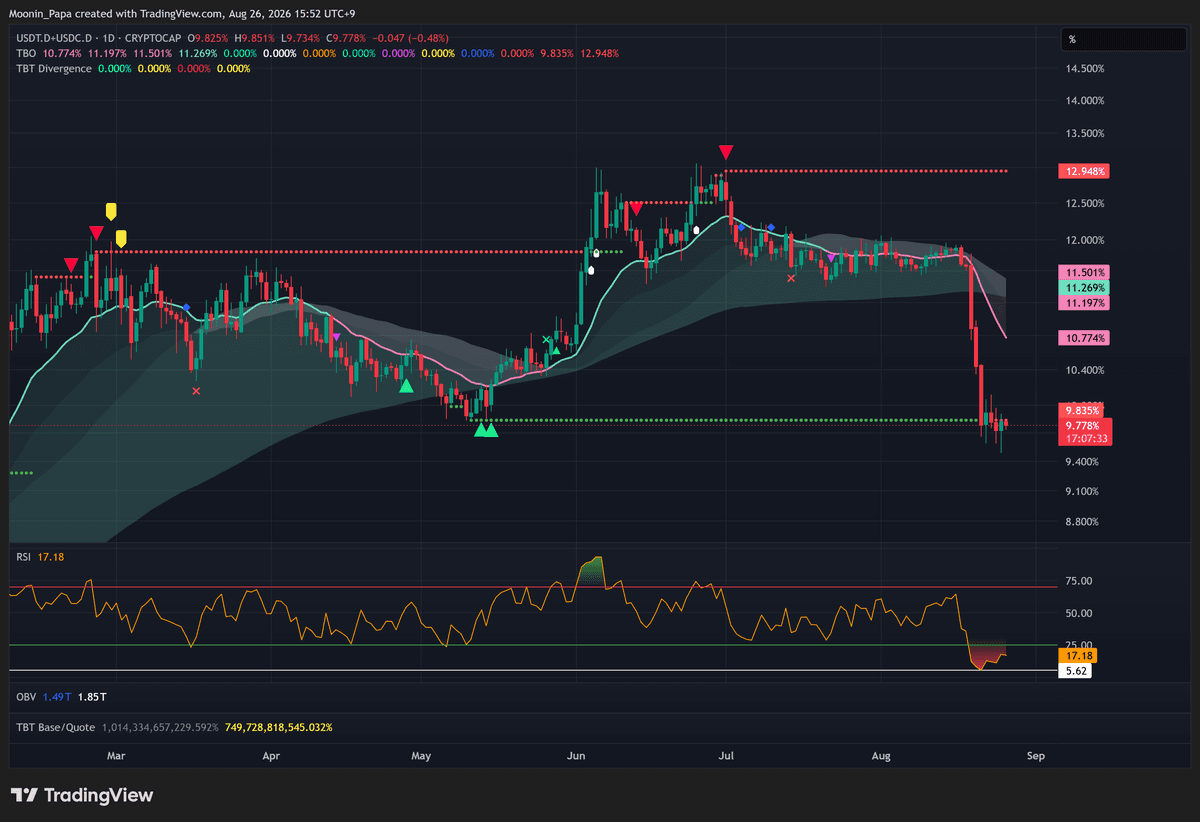
Combined stablecoin dominance daily chart
Combined stablecoin dominance remains below immediate TBO Support, indicating a strong bearish dominance trend. At the same time, it is overdue for a Fast-line bounce and shows clear bullish divergence evidence, which could produce a sharp dominance uptick and a crypto pullback. The January 2023 similarity is striking, but it is an analogy rather than certainty. Dominance is market share, not spot price.

Lower-cap rotation is early, but TOTALE is at resistance
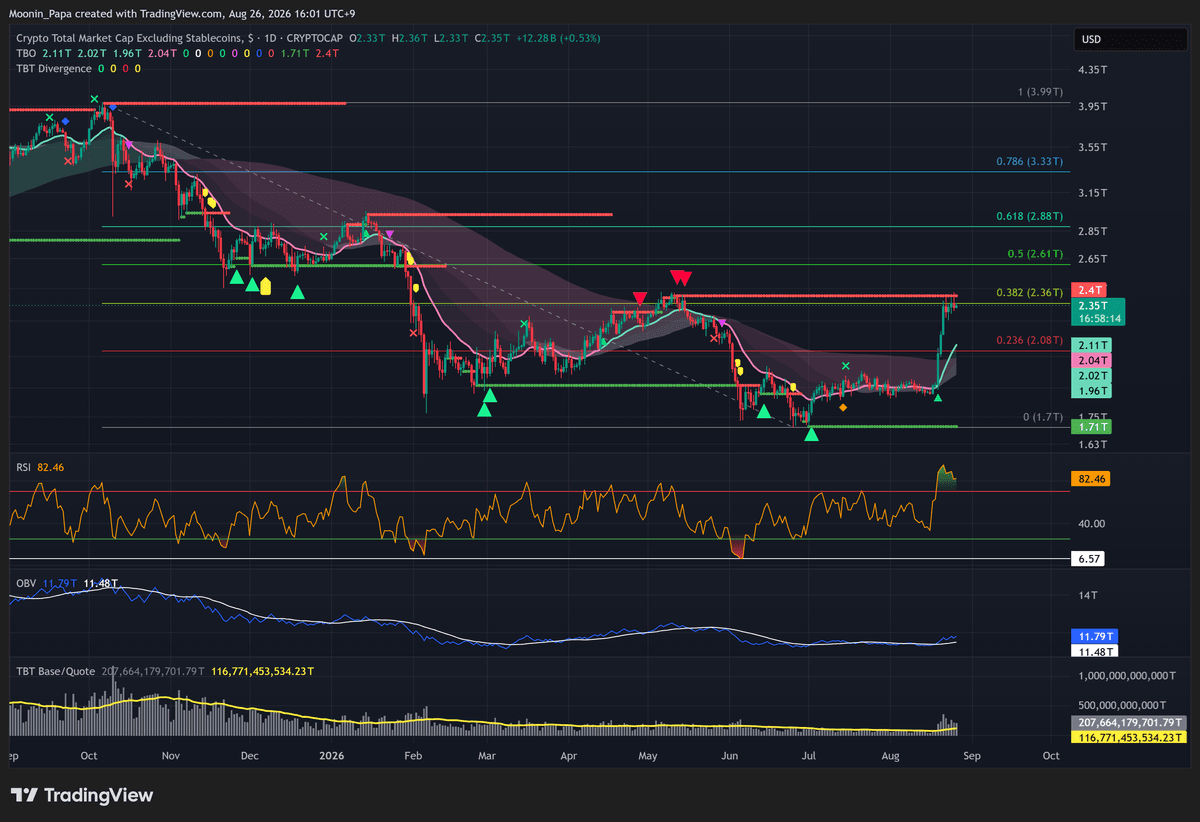
TOTALE daily market-cap chart
I see BTC.D rising a lot while ETH.D printed a TBT Bearish Divergence; money is flowing into BTC more strongly, although ETH.D remains very strong bullish. OTHERS.D suggests lower-cap rotation is starting, but it is still early. TOTALE is struggling at $2.4T TBO Resistance and the 0.382 Fib while price and RSI diverge. TOTALE50 is similar and TOTALE100 has not cracked above the daily Cloud, yet I remain optimistic even if BTC pulls back.
OTHERS and TOTAL3ESBTC show rare bullish breadth
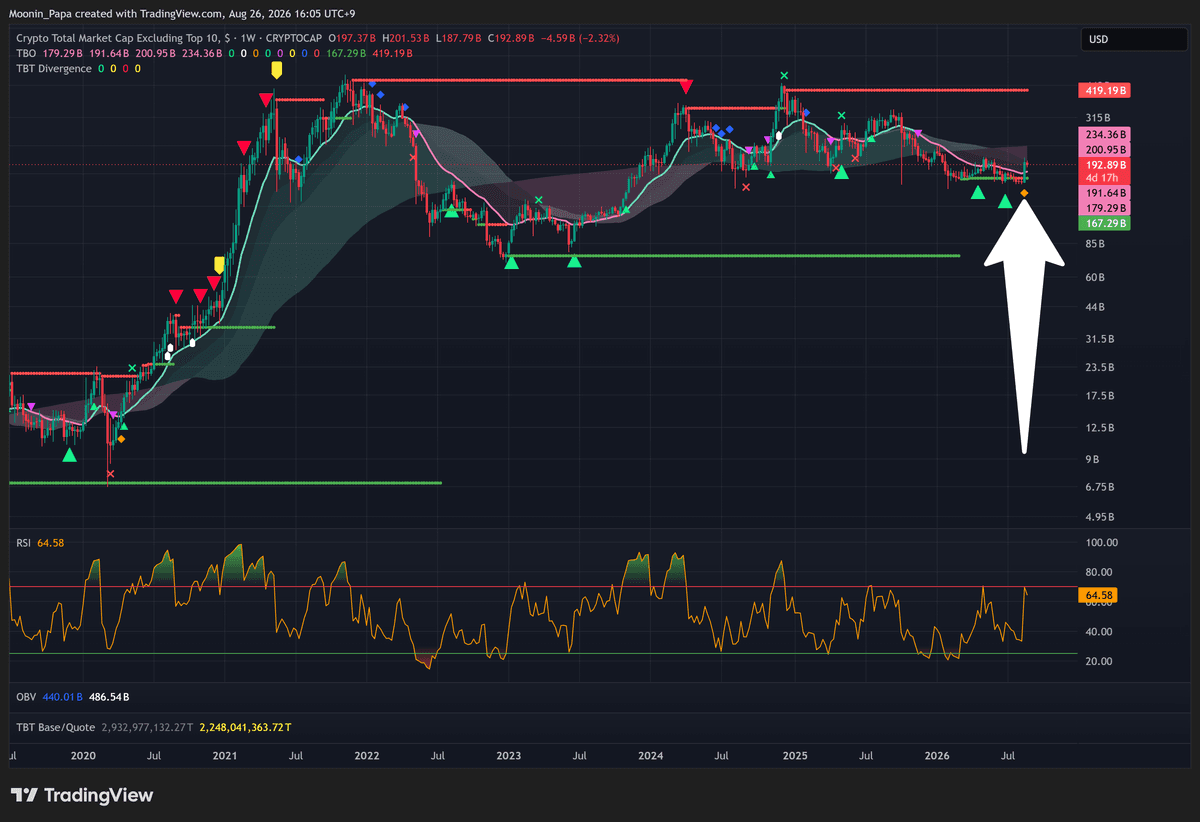
OTHERS weekly market-cap chart
OTHERS confirmed a weekly TBO Close Short, the first since April 2020. TOTAL3ESBTC is also early, its TBO Close Short closed on Tuesday's pullback, and I still expect continuation. These market-cap and ratio charts describe breadth and relative strength, not direct spot-price targets.
TradFi is quiet while individual ALTs diverge
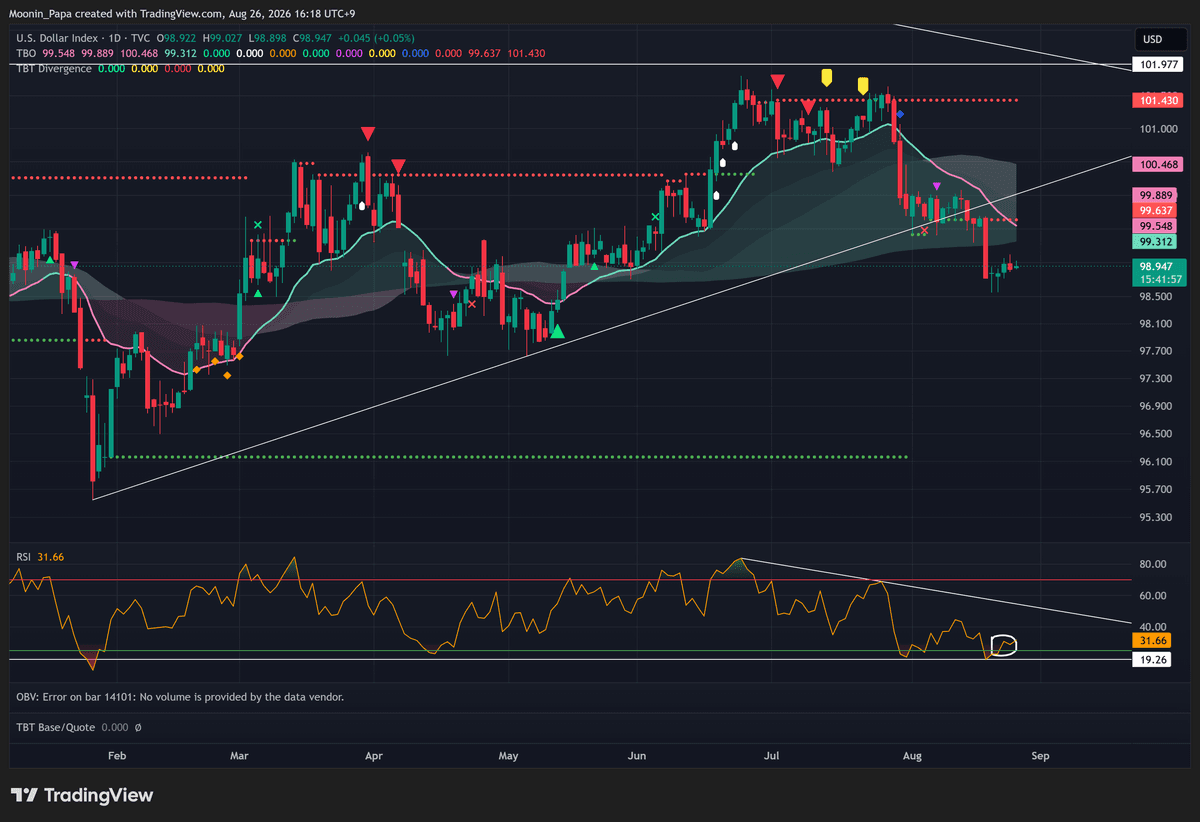
U.S. Dollar Index daily chart
I see DXY strong bearish below the Cloud; a deeper close below the Cloud would be favorable, but it is unconfirmed. S&P futures and major indices are boring. Nikkei remains in bearish consolidation while KOSPI is back in bullish consolidation. Gold rejected the 0.5 Fib while overextended and overbought; Silver may pull back, Copper is pumping and Uranium closed above the Cloud. Among ALTs, UNI's 4h TBT Bearish Divergence Cluster is a serious warning, while WLD and KAS show bullish confirmation signals. I keep those asset states separate.
Learn my strategies and the tools I use every day by visiting The Complete Cryptocurrency Investor by Mastering Assets.
