


Gold price has been under pressure recently extending its decline by $95 this week even as it had a minor gain today of $10.40 or 0.24%. The slight gain today can be explained by dollar weakness, with gold mirroring the dollar index’s 0.24% decline on the day.
Today’s move is a microcosm of the bigger picture, no new buyers or sellers entered the market today. In fact, many speculators are still on the sidelines awaiting gold’s reaction at current prices to determine which direction the next move will be. Gold’s month-to-month interest in the Comex futures markets has rebounded slightly off of a 20-year low seen in May. On a weekly basis open interest is at 412,800 contracts putting it right below its 50-week moving average which is trending sharply to the downside showing that gold traders are largely in a wait and see mode. This is because gold is at a crossroads, and a bullish reversal, or continued bearish price action – or both possible at the moment – and the next levels of support or resistance are over $100 away in either direction.
The technical outlook is mixed, with gold both showing weakness and resilience as it broke below its own 50-day moving average this week while still holding above its key support at the 61.8% retracement of the August rally.
In the spot market gold showed even more resilience gaining $25.86 on the day or 0.61%, roughly double the percentage gain in gold futures or the decline in the dollar. Spot gold is managing to stay above its last remaining moving average still acting as support, the 100-day SMA at $4,256.82. What one can make of this discrepancy is that traders still expect a further decline by December, the current most actively traded month in the futures market.
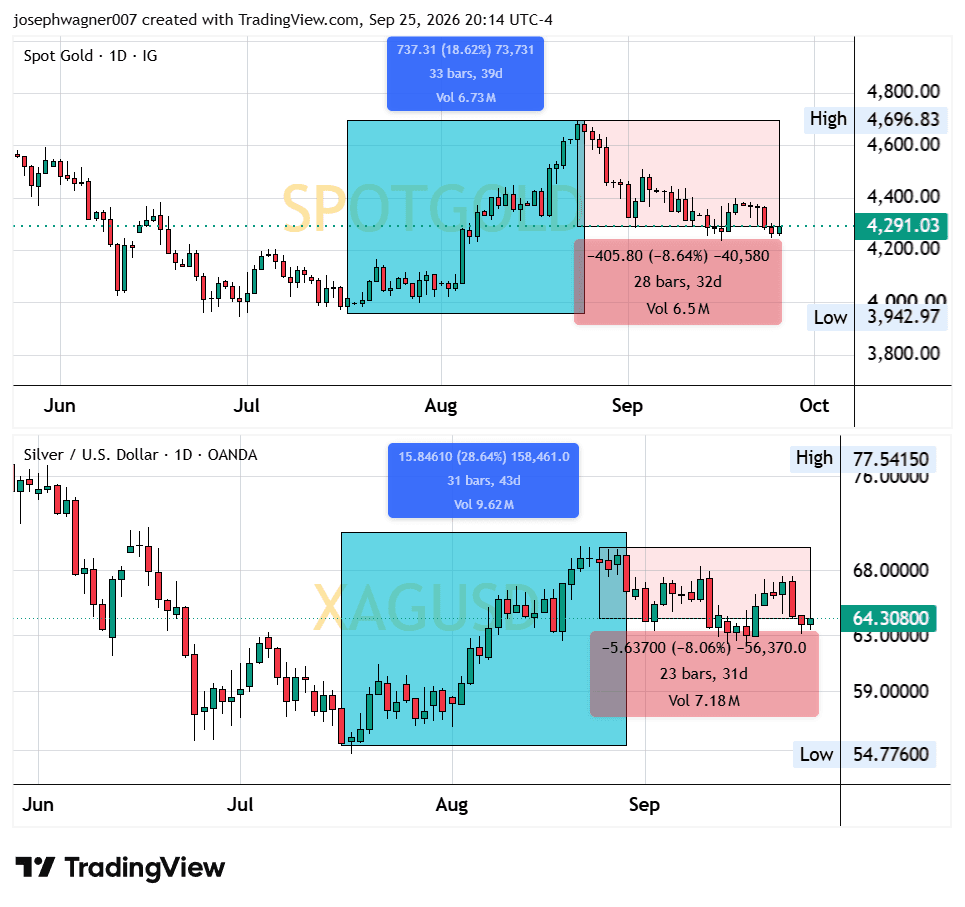
Silver is showing the same precarious positioning, albeit slightly less bearish technically than gold. While the decline from the highs seen in August roughly matches that seen in gold on a percentage basis, during the run-up silver outpaced gold the same respect as is usual for the sister metal. Which makes the declines roughly being an equally unusual occurrence in silver.
In both the spot and futures markets silver is remaining between two converging indicators that have defined support and resistance this entire month, with the 50-day MA at the bottom and the 100-day MA at the top. With both averages still angling towards each other silver will be forced to move outside these defining indicators in the weeks to come.
Silver has been caught in more of a lull than gold showing that futures traders are even more absent than in gold. Hitting what may be a multi-decade low below 100,000 contracts of open interest recently for the first week of May. It has yet to recover somewhat like in gold and remains at historically low levels of open interest showing that traders are even more uncertain in silver futures. While trading volume in gold futures had a dramatic decline after hitting its all-time high, volume in silver futures fell off a cliff during that same period.
So where have all the traders gone?
Have the precious metals remained resilient since the hawkish pivot from the Federal Reserve, or have they just been largely absent of traders and therefore sellers in the market?
The weeks ahead will determine which viewpoint proves to be correct.
Wishing you, as always, good trading.
For more info visit TheGoldForecast.com.
