
I’m not just going to tell you Bitcoin looks bullish. I’m going to show you exactly how I decide whether something is relatively bullish or relatively bearish, and what “relatively” means in this context, so you can use the same method yourself.
My version of “relative strength” isn’t about which asset moved a bigger percentage. Bitcoin and altcoins carry more beta than stocks, so they’ll always move further in both directions. What I’m looking at is how each asset is behaving against its own recent price action, support and resistance, etc., then comparing that to the other ticker. Is it making higher highs or lower lows? Is it holding support while the other one breaks down? When the other one bounces, does it bounce harder? That’s the comparison that determines recent bullishness vs bearishness.
For about a year, since the crypto bear market started last fall, that comparison was ugly for Bitcoin. It was making lower lows while the Nasdaq was making higher highs. Clear relative weakness. Recently that has flipped. While the Nasdaq has had a massive pullback since October 6th, Bitcoin’s price descent slowed and stopped, then held support when the Nasdaq dropped further. Now, on both the daily and the weekly time frame, Bitcoin is showing relative strength compared to the Nasdaq.
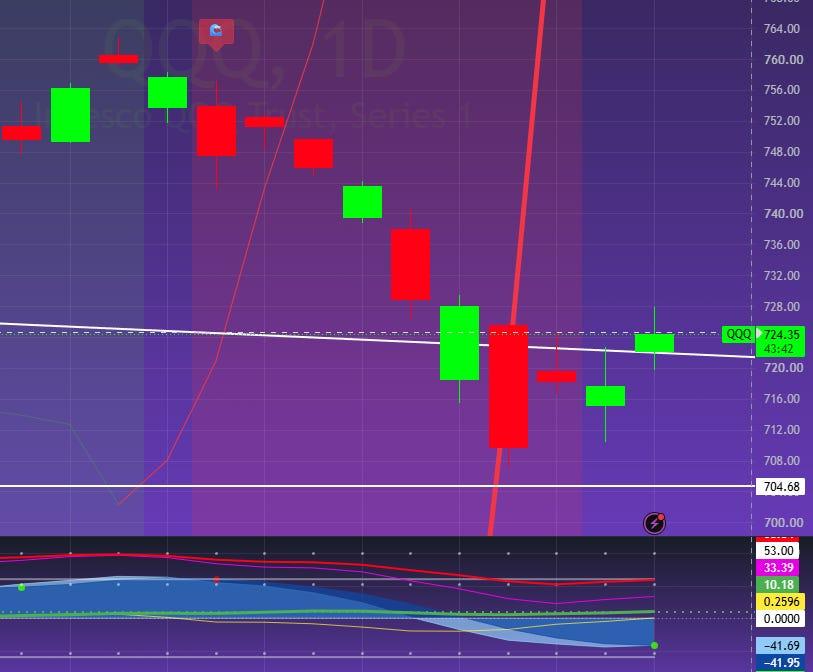
($QQQ Daily Chart)
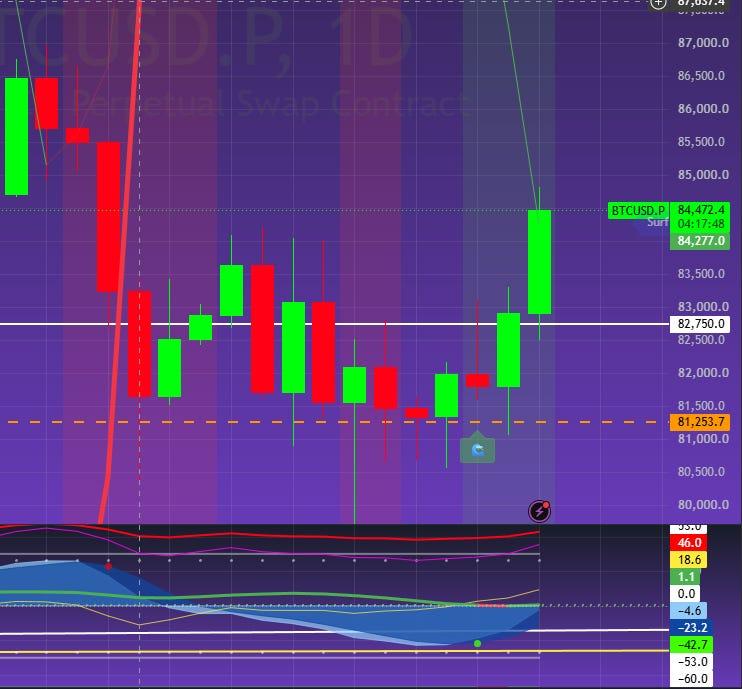
(BTC Daily Chart)
Why? In my opinion, it’s because the Nasdaq got so bullish that it’s reasonable to say stocks got overvalued. The Shiller CAPE ratio is sitting around 41, higher than almost any time in history outside the dot-com bubble. Bitcoin, on the other hand, was so bearish for so long that it appears to have found a bottom in July, and now wants to go up. Basically, the Nasdaq was overbought and Bitcoin was oversold.
The catch is that Bitcoin still trades as a risk asset and directionally with risk assets in general. So if the Nasdaq falls hard, Bitcoin won’t pump in the opposite direction at the same time. But when the Nasdaq has a green day, Bitcoin should pump harder, because it’s relatively bullish.
And this shows up on every time frame. If you scalp the 1-minute chart, you can see it clearly during periods of volatility, like right at the market open. When the Nasdaq drops, Bitcoin drops, but not as much. When the Nasdaq bounces, Bitcoin bounces a lot more. That’s relative strength on a super short time frame, and it’s lining up with what we’re seeing on the bigger time frames in aggregate. It’s been consistent for the last couple weeks.
Altcoins are currently a slightly different story. They’ve been lagging Bitcoin, and they actually seem to be tracking the Nasdaq more closely. You can measure that with the same method. The ticker I use to track altcoins as a group is TOTAL3, which is the total crypto market cap excluding Bitcoin and Ethereum. Run the same comparison on TOTAL3 against Bitcoin and against the Nasdaq, and you’ll see which one it’s actually following.
Where do we go from here?
On Monday I said Bitcoin was stuck between $81,000 and $82,800. Today it broke out. Bitcoin pushed through $82,800 and is trading around $84,500 as I write this.
Look at what happened at support (orange dashed line). Since the Nasdaq’s pullback from its October 6th all-time high, Bitcoin dropped into that $81,250 zone and it held. Even on the days the Nasdaq was dumping, Bitcoin wicked below it and closed right back above. Then the Nasdaq finally bounced, and Bitcoin bounced tremendously.
Now zoom out to the full pullback: Bitcoin dropped from around $86,500 to $81,250 and has already recovered more than half of that move. QQQ dropped from around $760 to $710 and has recovered less than a third. Same pullback, same bounce, and Bitcoin is outperforming to the upside. That’s relative strength you can actually measure. 💎
The momentum agrees. Bitcoin has a green dot on the daily Market Cipher B, and Swell Point is looking bullish as well. QQQ is also back above that diagonal trend line it lost last week, which gives Bitcoin a tailwind instead of a headwind. The one-week red dot from Sunday is still there, so I’m watching to see if this daily strength is enough to flip it by next week.
As long as Bitcoin holds above $82,800, I’m treating that old resistance as new support. If the Nasdaq keeps bouncing, Bitcoin should keep outperforming it. If the Nasdaq rolls over again, Bitcoin probably won’t pump, but I’d expect it to hold up better than tech, the same way it did last week.
This is the exact process I teach at CassiusCuvee.com, and it’s what the Swell Point indicator is built to help you see on your own charts. If you want my calls in real time, tap in with my private Discord group, The Profit Circle. General chat is free. 🌊
