
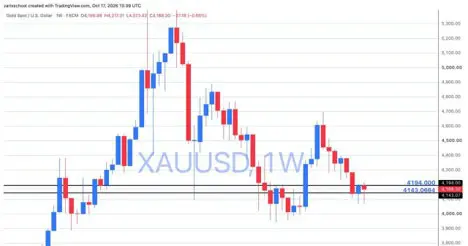
Gold is sitting at a critical turning point, and the next move could come down to one price level: $4,194.
My weekly analysis suggests gold has already formed a bottom after its recent decline. But there's a difference between identifying a potential bottom and seeing buyers confirm it.
That's why I'm watching $4,194 so closely.
A close above that level would strengthen the case for a recovery. A break below $4,104.96, on the other hand, could send gold back toward its previous lows.
Gold's Weekly Bottom Faces a Key Test
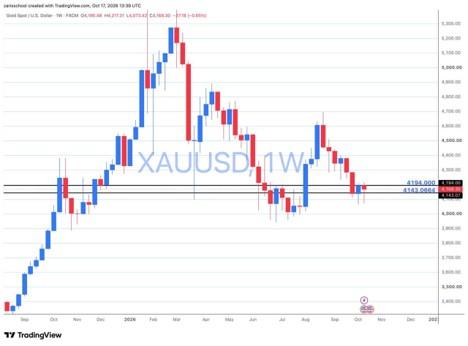
The weekly chart is showing signs that the recent correction may have reached its low.
I believe the bottom is already in place, but I still want to see a weekly close above $4,194 before calling it confirmed.
That would be an important change in the chart's structure. It would suggest buyers are beginning to regain control after weeks of selling pressure.
For now, gold remains close to the $4,143 area, with $4,194 acting as the immediate hurdle.
Until that resistance gives way, the weekly recovery remains a developing setup rather than a confirmed upward move.
The Daily Chart Points to the Same Level
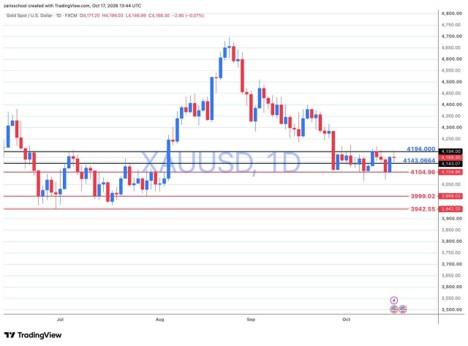
What makes $4,194 especially interesting is that it matters on both the weekly and daily charts.
Gold has been moving sideways after its latest decline, with buyers repeatedly trying to push prices higher.
A daily close above $4,194 would be my confirmation that a new upward move is beginning on the daily chart.
A weekly close above the same level would carry even more weight because it would confirm the larger bottoming pattern I've been following.
I'm not looking for a quick move above resistance that fades before the close. I want to see price finish above the level.
That distinction could make all the difference.
What Happens if Gold Drops Below $4,104?
The bullish setup isn't the only possibility.
If gold fails to clear $4,194, another move lower remains on the table.
The first major level to watch is $4,104.96.
As long as gold holds above that support, the potential recovery remains possible. But if price breaks below $4,104.96 and stays there, I would shift my outlook toward another decline.
The next downside levels would be:
- $3,999.02: The first deeper support area.
- $3,942.55: A lower support level that could come into play if selling pressure continues.
A move toward those levels would suggest gold still needs to complete its bottoming process.
In other words, the recent low might not be the final one.
Two Scenarios Worth Watching
Bullish scenario: Gold closes above $4,194
A daily close above $4,194 would support the start of a recovery. If the weekly candle also closes above that level, it would confirm the weekly bottom in my analysis.
That would give me more confidence that buyers are taking control.
Bearish scenario: Gold breaks below $4,104.96
If gold loses $4,104.96 and remains below it, the risk of another decline increases.
Under that scenario, $3,999.02 and $3,942.55 become the next levels to watch.
The important thing is that both scenarios have clear conditions. There's no need to guess which direction gold will take before price provides confirmation.
My Gold Outlook
I'm still leaning toward the idea that gold has formed its weekly bottom. But I'm not treating the next rally as a done deal.
The market needs to prove it.
Above $4,194, the bullish case gets stronger. Below $4,104.96, another move toward the lows becomes more likely.
Until one of those levels gives way, patience makes more sense than trying to predict every short-term move.
For now, $4,194 is the number I'm watching most closely.
