
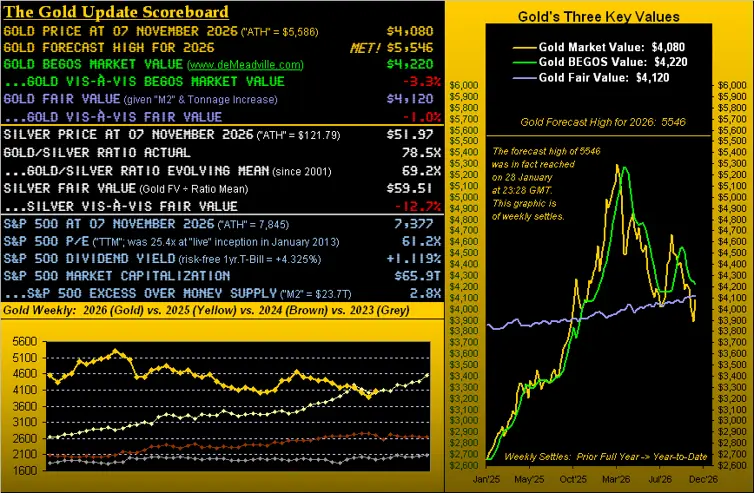
(Kitco Commentary) - Last Monday’s Prescient Commentary opened with: “November kicks off a busy week of StateSide elections’ results, employment data and earnings.” Now in hindsight, “busy” was an understatement; rather, the better adjective would have been “frenetic”. For Gold intra-week got chuffed in rising low-to-high by +6.9% whereas the S&P 500 got stuffed in falling high-to-low by -4.7%, the  “Combination of the Two” [Big Brother and the Holding Company, ’68] a most pleasing “pas de deux” one has to say, given the undervaluation of Gold and overvaluation of the S&P.
The week’s respective net changes were for Gold +5.0%, its fourth-best of the 44 full trading weeks year-to-date, and for S&P -2.7%, its worst so far in 2026, indeed since that ending 04 April 2025. With respect to the latter, the FinMedia freaked out: “…virtually nowhere to hide…” “everyone rushed for the exits…” et alia.
“So they must still think Gold is just a nowhere, worthless old relic, huh mmb?”
So are the optics of those phrases, Squire. Today’s financial writers/reporters have no concept of what “everyone rushed for the exits…” looks like: the S&P’s intra-week drop of -4.7% is peanuts. We all too well recall the commencements of the Garzarelli Cavatelli in ’87, the Asian Contagion in ’97, the Russian Debt Crisis in ’98, the DotComBomb in ’00, the FinCrisis in ’08 and more recently of course the Ovid to Covid in ’20. And as you valued veteran readers of The Gold Update know, we continue awaiting the “Look Ma! No Money!” calamity (to put it mildly) per the “S&P 500 Excess Over Money Supply” as depicted in the opening Scoreboard at 2.8x.
In fact, as on occasion is our wont, let’s start with stocks via this updated graphic of the S&P 500 from 1970-to date, courtesy of the “A Picture is Worth a 1,000 Words Dept.” Here ’tis, (monthly settles to today’s 7377):

“Also mmb, by a log chart, its own regression line is only now around 4880…”
Right, Squire, some -34% below today’s S&P level of 7377, even as that $7T injected COVID dough ain’t goin’ away; (recall the market capitalization of the S&P 500 straightaway increasing by same).
From our viewpoint, we see a good news/bad news scenario for the S&P. The good is that per the Stateside elections, “gridlock is good”: the Legislative Branch shall go giddy with new laws only to have the Executive Branch veto them, and we’ve known through the decades that when Congress gets stalled, ’tis generally good for both the economy and stock market. The bad is (per the above graphic) the S&P’s stratospherically-high P/E ratio, (even ex-CRWD): that 41.6x is nearly triple the 11x-15x deemed “acceptable” for a bull market as taught in portfolio theory, (which for you WestPalmBeachers down there is back when analysts actually performed a science called “mathematics”). But enough over silly stocks. Let’s get to Gold!
And by our weekly bars graphic from this time a year ago-to-date, Gold just etched a sixth red dot of parabolic Short trend. But of greater import, price’s recovery week in settling yesterday (Friday) at 4080 notably narrowed the gap toward flipping the trend to Long (were 4540 improbably to trade in the ensuing week) from 583 points to 461 points. Given Gold’s expected weekly trading range is now 205 points — combined perhaps with a November seasonality boost — we may find the trend having flipped to Long by month’s end. Indeed, three of Gold’s last four Novembers have been positive. Moreover, per the title of last week’s piece for Gold and Silver: “Whoa Are They Cheap!”

And speaking of Sweet Sister Silver, here next is our rarely-shared chart of her weekly bars, the red-dotted parabolic Short trend now a formidable 40 weeks in duration! With Gold at its present 4080 level, were Silver to be priced at the Gold/Silver ratio’s evolving mean of 69.2x (rather than at today’s 78.5x), she’d be 12% higher at 58.92 instead of her week’s settle of 51.97. Too, by the opening Scoreboard, Fair Value for Silver is now 59.51. “So c’mon Sister Silver!”

“Well, copper’s also been coming down a lot lately, mmb…”
Squire, old Cousin Copper from his 22 September all-time high of 6.9285 is now -9.6% lower at 6.2600; he thus has negatively affected Sister Silver … but hardly to the extent of her having plunged -23.7% across the same stint! Even Gold for that like period is but -7.6%. We therefore really do love Silver down here!
So let’s in turn go to the two-panel graphic of her daily bars from three months ago-to-date on the left and 10-day Market Profile on the right. Silver’s baby blue dots of regression trend consistency are just now barely curling upward. Upon their confirming a close above the -80% axis, we’ll look for still higher prices, although you can see the overhead array of upside structural price blockages. Regardless we know that when Silver goes, she GOES! And as to her Profile, the week’s gain of +5.5% hoisted Silver well above the basement in which she was cowering a week ago; today at 51.97, she is poised just beneath her most volume-dominant price resistor of the past fortnight of 52.05 as labeled:

Gold’s like graphic finds the “Baby Blues” (below left) having just come up off their -80% axis, although price by “exception” struggled from the same setup back in early October; hopefully the “rule” for higher prices shall come through this time. By the Profile (below right), price has climbed above what is now volume-dominant support from 4073 down to 4026. So: has “The Floor” of 4000 been saved? ‘Tis a bit soon to tell, should price by the weekly parabolic Short trend become further enslaved:

Next we go to the Economic Barometer. The StateSide opposition will have firmly taken control of Congress effective 03 January 2027, (albeit well short of veto override ability). To be sure, the vote against the current Executive Branch was fairly fierce, given war, inflation, if not simply significant scorn spawned by social media of the current Oval Officer holder. That said, regardless of political alliance, any sitting U.S. President is charged with responsibility over the economy. And inflation notwithstanding — as we herein summarize each month (the current averaged annual summation running at +4.3%, which is double the desired Federal Open Market Committee’s +2.0% pace) — the economy on balance is doing reasonably well, notably as reflected during this Q3 Earnings Season. With still two weeks to run, of the 415 constituents in the S&P 500 having reported, 79% have bettered their bottom lines over Q3 of a year ago, which as we penned in yesterday’s Prescient Commentary: “(excluding the recovery out of COVID) is on track to be the best performance since Q3 of 2018” Also as was embedded in last week’s view of the Econ Baro, from the FOMC’s 28 October Policy Statement: “Economic activity is expanding at a strong pace … [albeit] … Inflation remains elevated.”
Indeed specific to just this past week, the Baro took in 15 metrics of which 10 bettered their prior period, two were steady, and thus just three were worse. Outstanding in beating both consensus and the prior period — itself revised higher in each case — were October’s Nonfarm Payrolls, Hourly Earnings, September’s Factory Orders, and Q3’s Productivity. Think the FOMC shall forced to raise the Bank’s funds rate at its 08/09 December meeting? Perhaps even by +50bp? Either way for this past week, straight up went the Baro and straight down went the S&P:

Next week is highlighted by October inflation at both the retail level (Consumer Price Index) and its leading wholesale level (Producer Price Index). And by consensus, both measures are expected to actually have cooled:

But we’re looking for Gold and Silver not to cool!
Cheers!
