

(Kitco Commentary) - November 19, 2026. On Wednesday, Bitcoin came within $20 of Sunday’s low and held. Its daily relative strength index (RSI) has now spent seven days oversold. Measure Bitcoin against gold, though, and the momentum picture has already changed. Thursday’s six charts show where buyers have gained ground and where they still have work to do.
Bitcoin gives the same low a second test
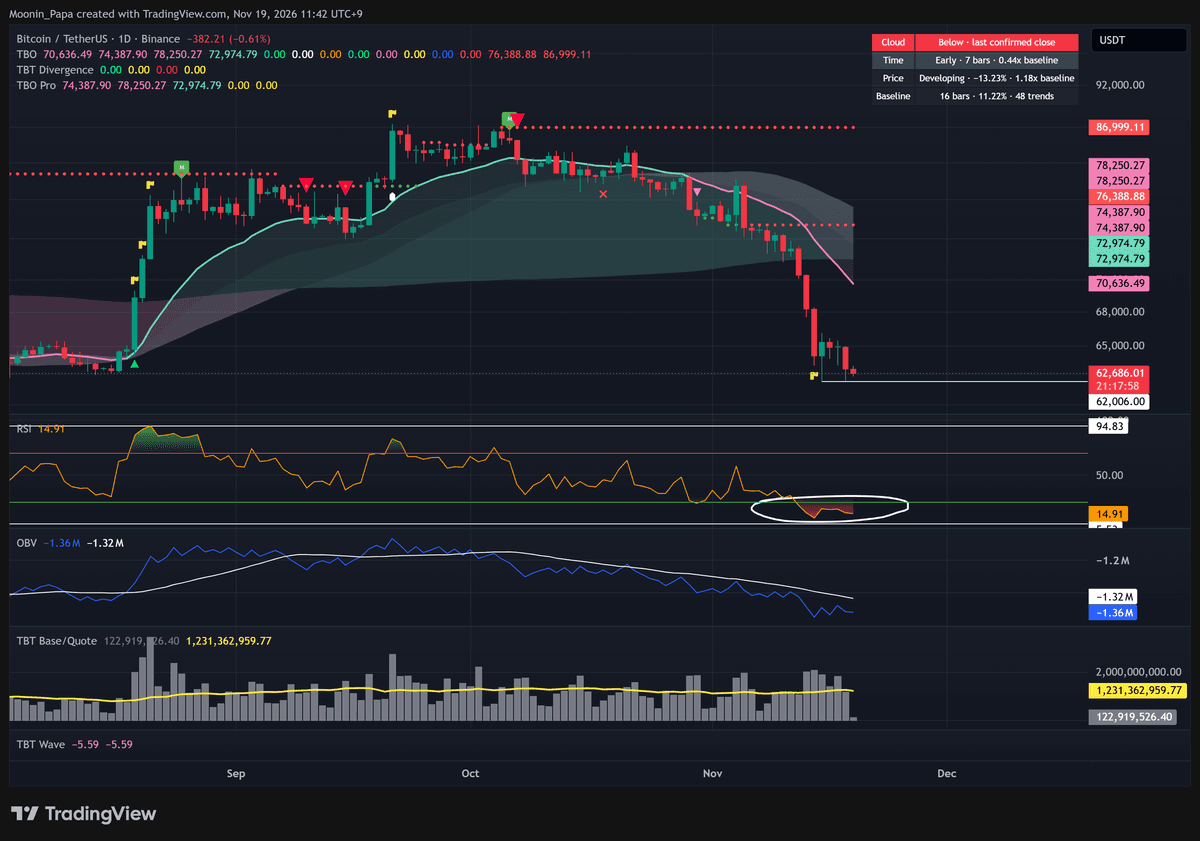
The narrow gap between Sunday’s low and Wednesday’s makes $62,000 a useful reference for the next move. I’m watching for a bounce and a bullish RSI reset on the daily Bitcoin chart. That reset has yet to print on BTC/USDT.
June gives us a reason to keep Wednesday’s low marked even if price lifts from here. Back then, Bitcoin found a short-term floor and rallied to the TBO Fast line, a trend indicator above price. It then came back through the earlier low. A similar sequence would allow for a sizable bounce before we know whether this week’s low can hold.
Ether’s oversold streak stretches to nine days
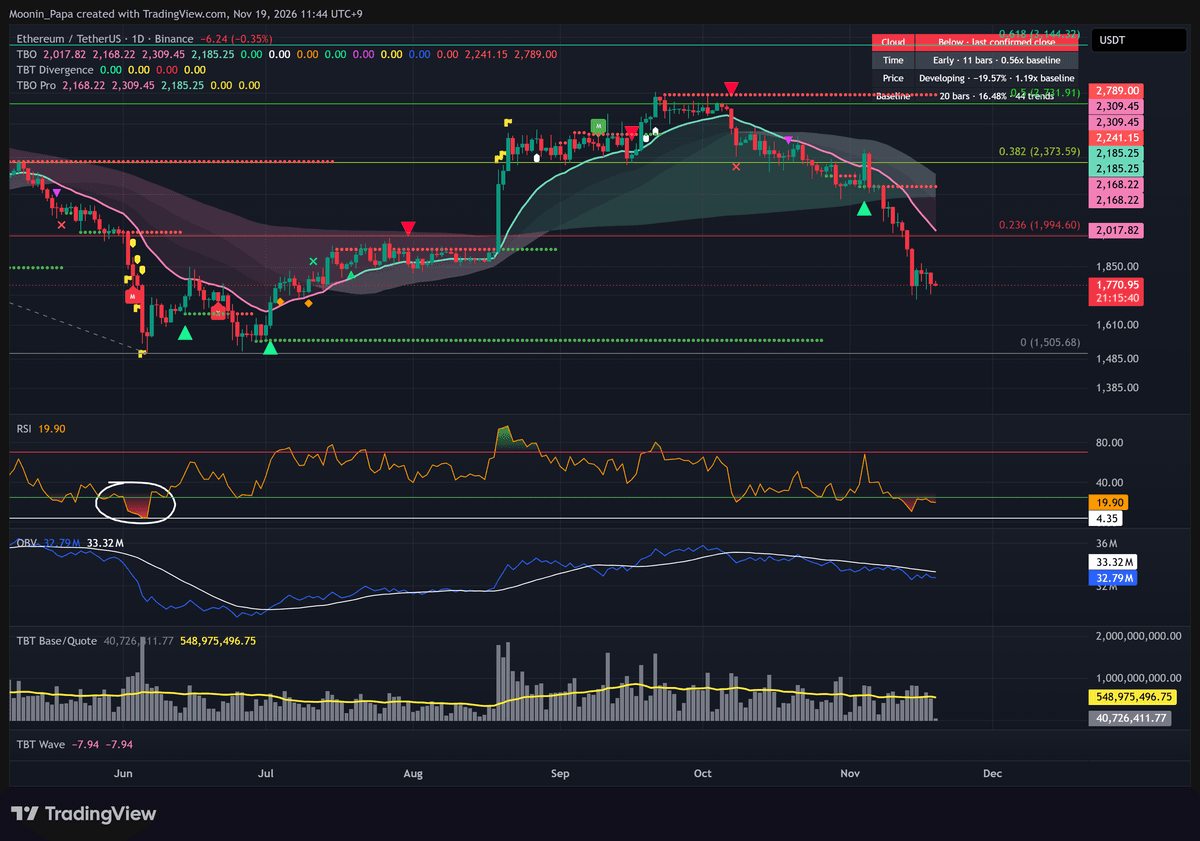
Ether has stayed oversold on daily RSI two days longer than Bitcoin. A rebound toward its Fast line could squeeze traders who sold short late in the decline. The 0.236 Fibonacci retracement is where I’d expect that move to run into resistance. A recovery of that kind could also produce a bullish RSI reset.
Ether has already held up slightly better than Bitcoin since the drop. Even so, ETH/BTC is still below its Cloud, the trend band on the chart. I’m watching how the pair handles its next test of the Fast line.
Bitcoin loses market share, with a rebound risk for altcoins
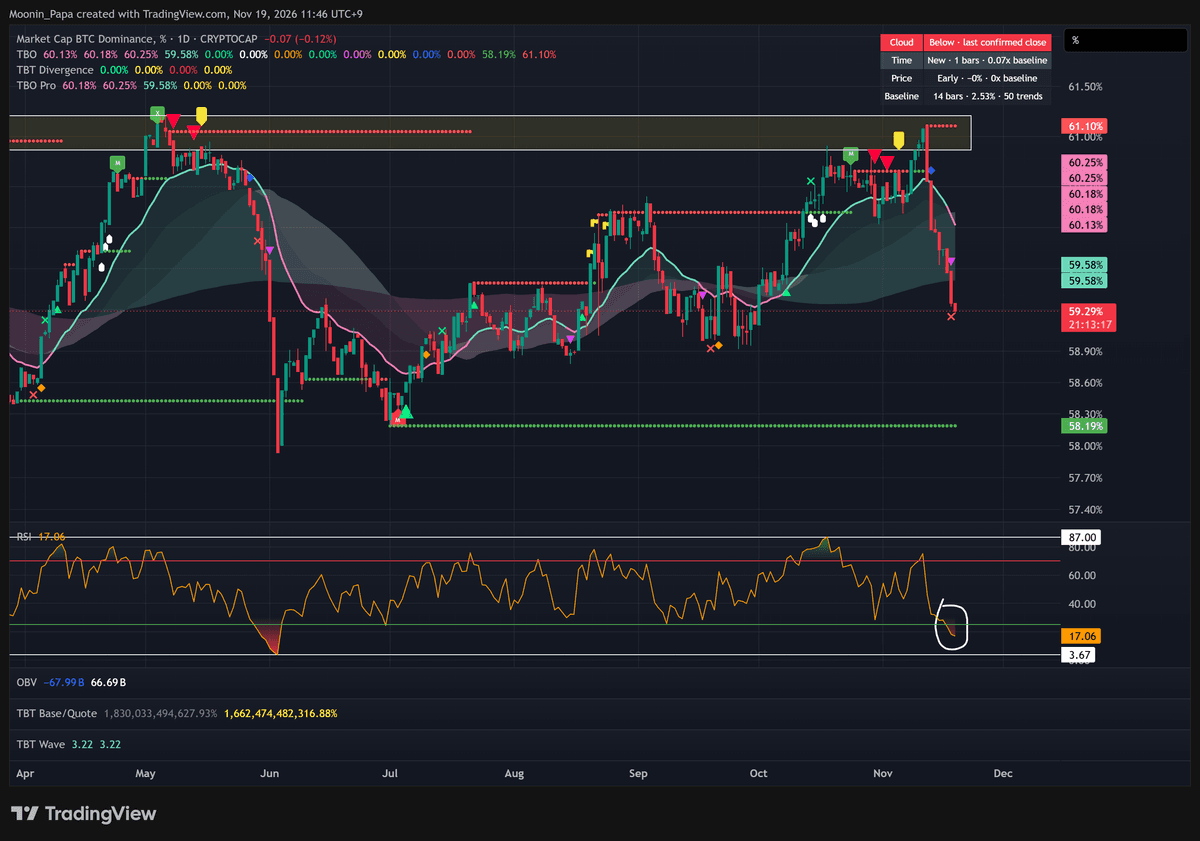
Bitcoin dominance measures Bitcoin’s share of the total crypto market. On Wednesday it confirmed a daily TBO Open Short and fell below the Cloud. That puts dominance in a strong bearish trend. Its RSI also reached oversold territory. If Bitcoin’s share rebounds from here, altcoins could give back some of their relative gains.
On the weekly chart, a different signal, a TBO Close Long, is still developing. I’d want to see it confirm and weekly dominance drop below its Cloud before calling a lasting shift away from Bitcoin.

Smaller altcoins take a larger share of a weak market
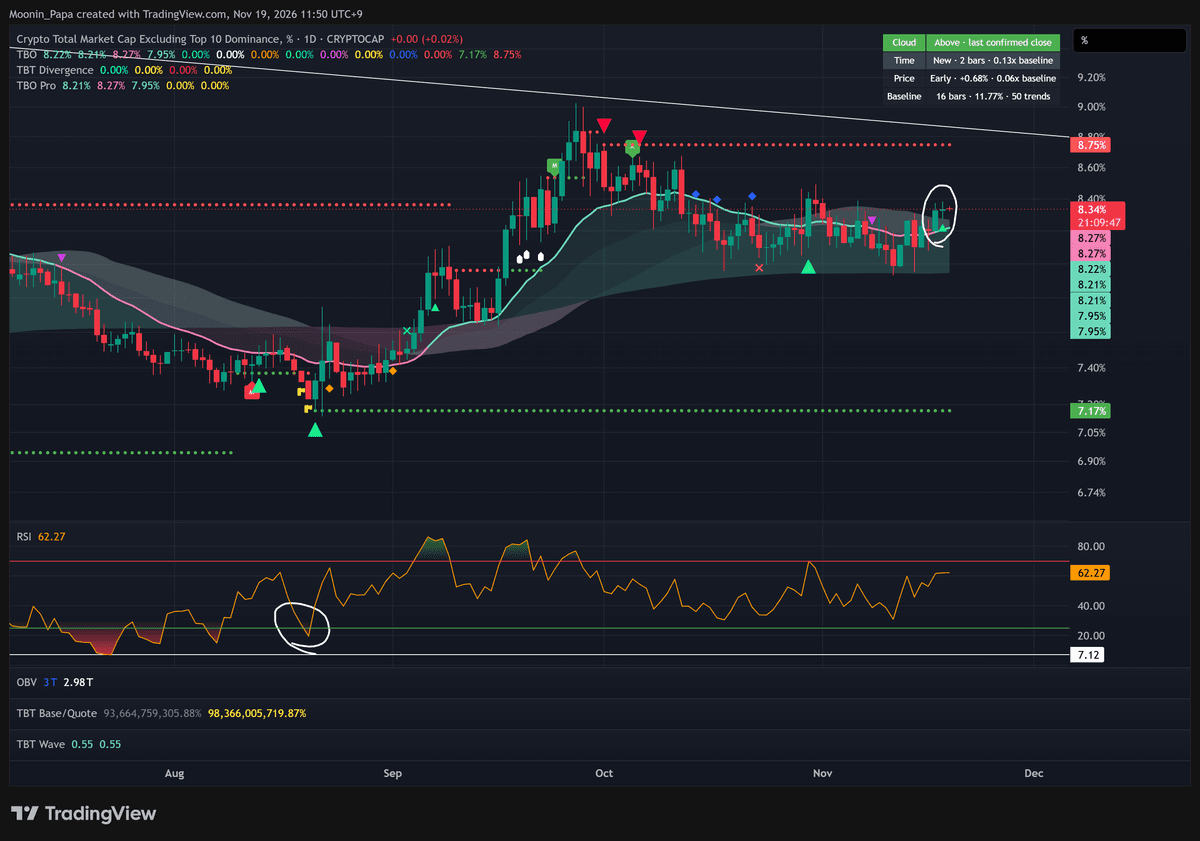
OTHERS.D, the market share of coins outside the top ten, confirmed a daily Open Long and closed above its Cloud. The dollar value of the same group, tracked by OTHERS, remains below its Cloud in a strong bearish trend. A basket can shrink in dollars and still claim a bigger share if the rest of the market falls faster.
The shift extends beyond this one index. On Wednesday, TOTALE50.D closed above its Cloud and TOTALE100.D closed inside its Cloud. Their dollar market-cap counterparts remain below their Clouds. For now the clearer evidence is in relative performance.
Gold’s weekly support fan puts the downside in perspective
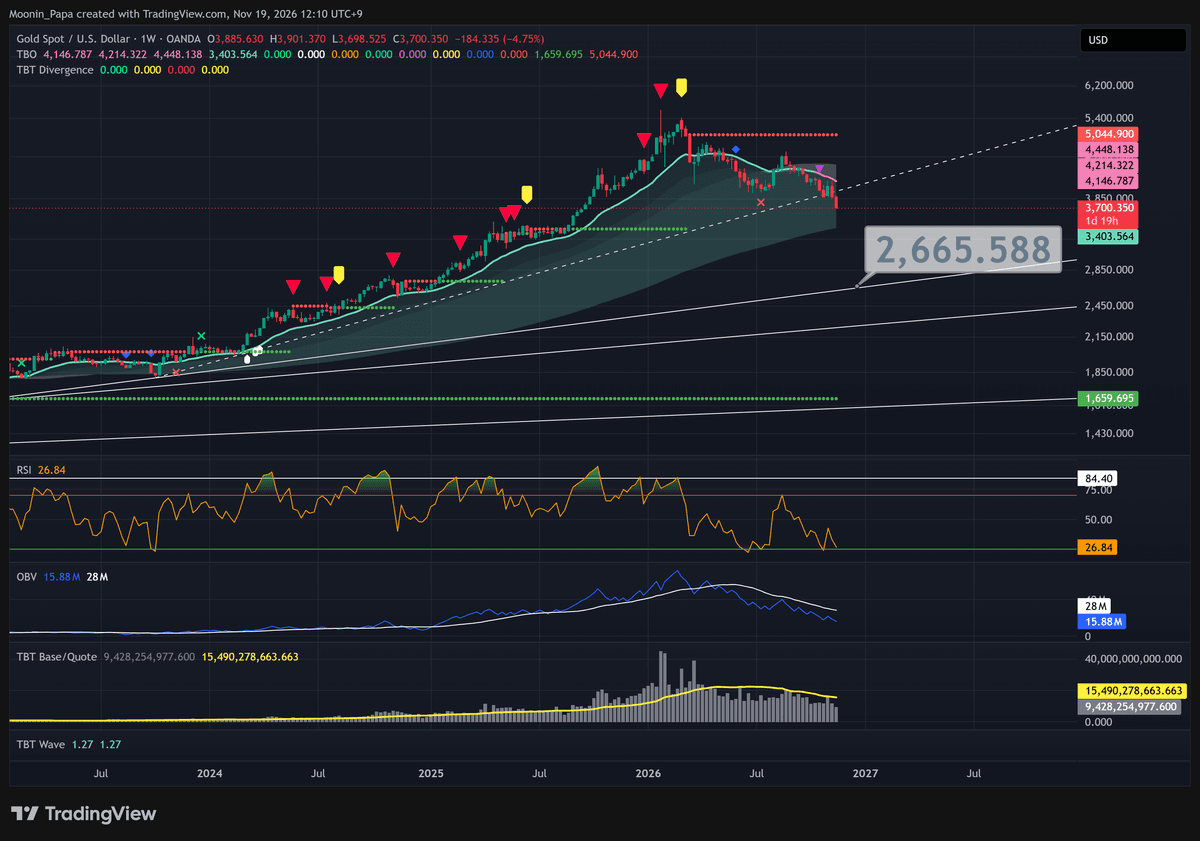
Gold is oversold again on daily RSI within a strong bearish trend. To see how much distance could remain if the decline deepens, zoom out to the weekly spot chart. One line on my long-term support fan points to roughly $2,665. Reaching it would take a substantial further decline. I’m treating that line as a downside scenario, with the timing and a test of the level both open.
Bitcoin measured in gold already has a bullish RSI reset
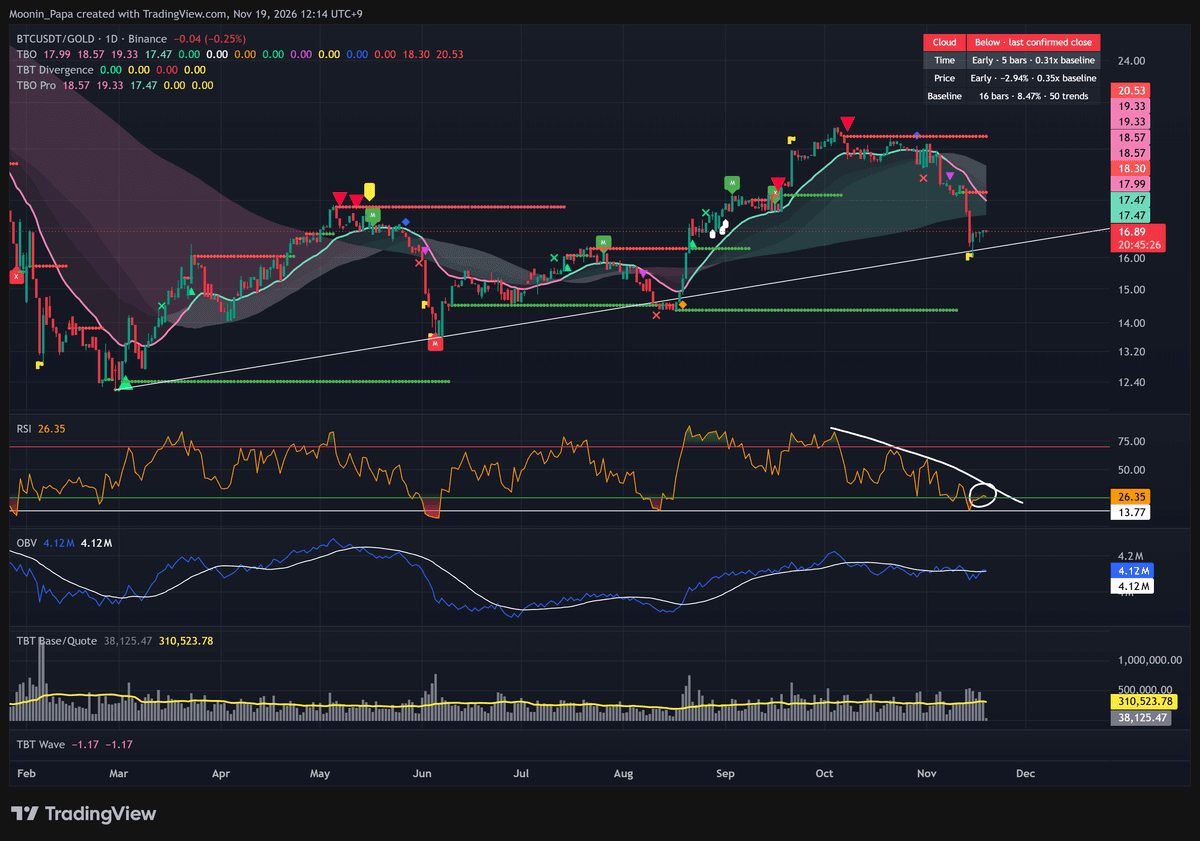
The daily BTC/gold ratio has printed a bullish RSI reset while it remains below its Cloud in a strong bearish trend. This ratio tracks how much gold one Bitcoin buys. Bitcoin can gain ground on gold even while both assets fall in dollars.
That leaves two separate questions for the next few sessions. Can the ratio build on its reset? And if Bitcoin bounces in dollar terms, can it hold this week’s lows on the next pullback? The ratio has given us an early clue on the first question. The second still comes back to $62,000.
Learn my strategies and the tools I use every day by visiting The Complete Cryptocurrency Investor by Mastering Assets.
