
(Kitco Commentary) - Gold’s slide accelerated on Thursday. December gold futures opened at $3,730.30 and managed a modest early rally to $3,759.50, but that was as good as it got. Sellers quickly took control and drove the contract to an intraday low of $3,620.60 before it finished at $3,627.30, down $100.50 or 2.70%. That marks a second consecutive triple-digit loss gold has occurred four $100+ declines over the past seven trading sessions and a. Just as telling was where gold closed. Finishing within a few dollars of the session low tells us buyers never showed up in the afternoon, and there was no serious attempt to defend $3,700 once that level gave way.
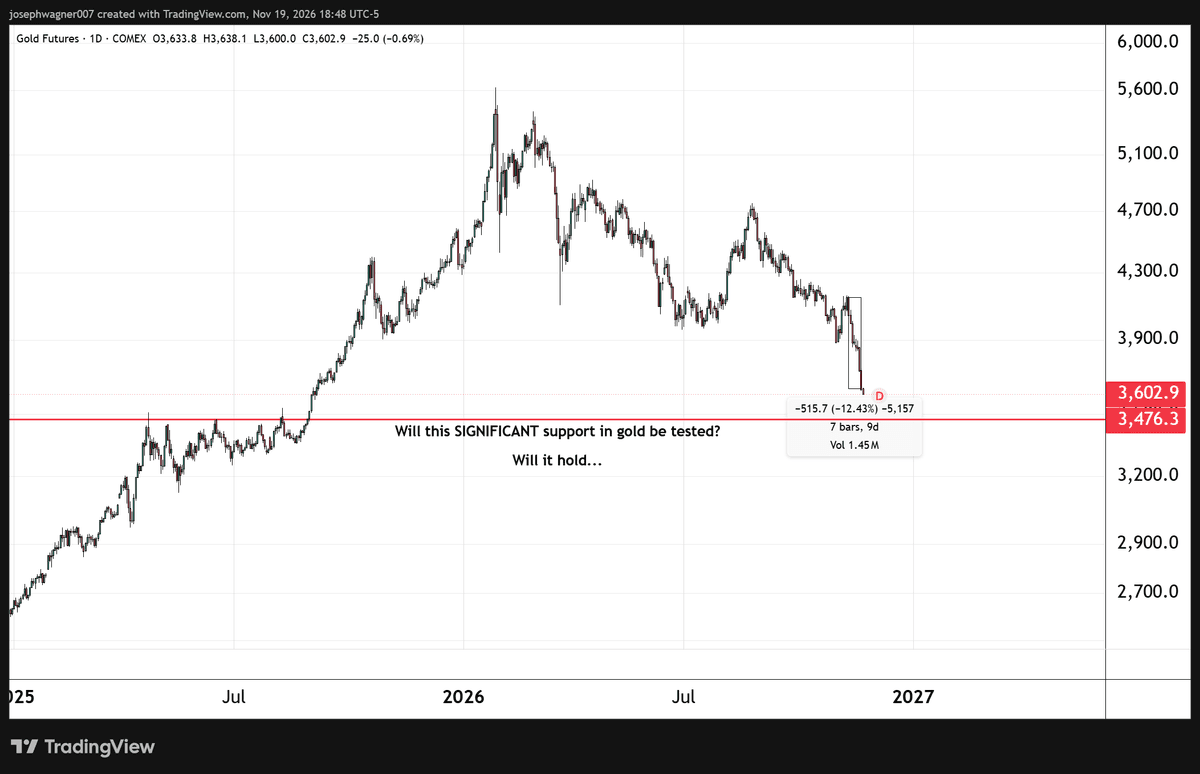
It is worth stepping back to see how far this decline has come. Including today, December gold has lost roughly $520 over the last eight sessions. The contract now trades about $2,150, or 37%, below its record near $5,780 set in late January, 12.43% over the past eight sessions alone. On the daily chart, each of this year’s important support levels has now been broken, from the summer lows just above $4,000 to the late-October low just under $3,900. When a market cuts through support levels this quickly, it is usually a sign that sellers are not only in control but are being joined by traders who are being forced out of their positions.
Last Friday I argued that this selloff has much more to do with interest rates than with the dollar, and the bond market continues to make that case. In early November, the 10-year Treasury yield bottomed near 4.82%. Last week’s hotter-than-expected CPI report sent it surging back above 5%, and by the end of the week it had touched roughly 5.17%. It has closed above 5% in every session since. Over that same stretch, gold futures fell from their early-November high near $4,150 to Thursday’s close. Put simply, a rise of roughly 35 basis points in the 10-year yield has coincided with a decline of more than 12% in gold.
Thursday’s session added a wrinkle to that story. The 10-year yield actually eased, opening at 5.076%, trading as low as 5.040%, and ending the day near 5.05%. Weekly jobless claims came in at 203,000 against expectations of 197,000, a slightly softer labor reading that helped take a little pressure off yields. Yet gold still fell more than $100. That tells me that while rising rates set the stage for this selloff, the selling now has a momentum of its own. Once a market breaks one support level after another, stop-loss orders and forced liquidation can carry prices lower even on days when the fundamental pressure lets up.
You can see who is doing much of that selling in the ETF flows. Over the last 30 days, the SPDR Gold Trust (GLD) has seen more than $1.37 billion in outflows, and the iShares Gold Trust (IAU) has lost roughly $279 million. This is the rate-sensitive money: investors and funds who can move freely between gold and Treasuries and, for now, are choosing the yield. With the 10-year paying more than 5%, holding a metal that pays nothing is a difficult case to make for anyone who measures gold against what a risk-free government bond offers.
On the other side of the market is a very different buyer. According to the World Gold Council, central banks bought about 321 tonnes of gold in the third quarter, a 42% increase from a year earlier. These buyers are not trading the Fed. They are diversifying their reserves for geopolitical and strategic reasons, and a 5% Treasury yield does not change that calculation. That demand is real, but it should not be oversold. The WGC still expects total central bank purchases this year to come in below 2025’s 863 tonnes, and not every central bank is a buyer. Turkey has sold close to 60 tonnes this year.
That is the tension now setting gold’s price. Patient money is buying steadily, but hot money is leaving faster, and for now the hot money is setting the direction. Central bank demand helps explain why gold has not collapsed outright, but it is not strong enough on its own to turn the market around while Western investors continue to head for the exits.
Next Stop $3,500 For Gold Futures & Will That level Hold?
Going forward, the 10-year yield chart is the one I would watch most closely. The 5% level is the first line of support, and a close back below it would be the first sign that the pressure on gold is beginning to ease. On the upside, 5.21% is the key resistance level, the point where yields broke down in mid-October. A move back above it would likely bring October’s high near 5.37% back into view, and gold would almost certainly struggle further. The Federal Reserve meets on December 8 and 9, and with CME FedWatch pricing roughly a 96% chance of a quarter-point hike, the hike itself is largely priced in. What matters now is how much further the Fed signals it is prepared to go in 2027. For gold futures, $3,500 is the next level of strong technical support to watch, while a recovery back above $3,700 would be the first step toward stabilizing.
I would argue that a lasting bottom in gold needs yields to roll over first. Until the market believes rates have peaked, ETF outflows are likely to continue. Once yields turn, central bank buying will help decide where the floor forms and how quickly gold can recover. The million-dollar question is, “will gold recover before the historically significant triple top at $3,500 is broken?"
Keep these numbers in mind, three weeks of 5%+ in yields (10-year) will likely bring gold futures down to test significant support at $3,500;
3×5% = $3,500.
Wishing you, as always, good trading.
For more daily in-depth and unique gold market analysis, visit us and sign up for our free service at thegoldforecast.com.
