

Bitcoin and Ethereum Price Dynamics
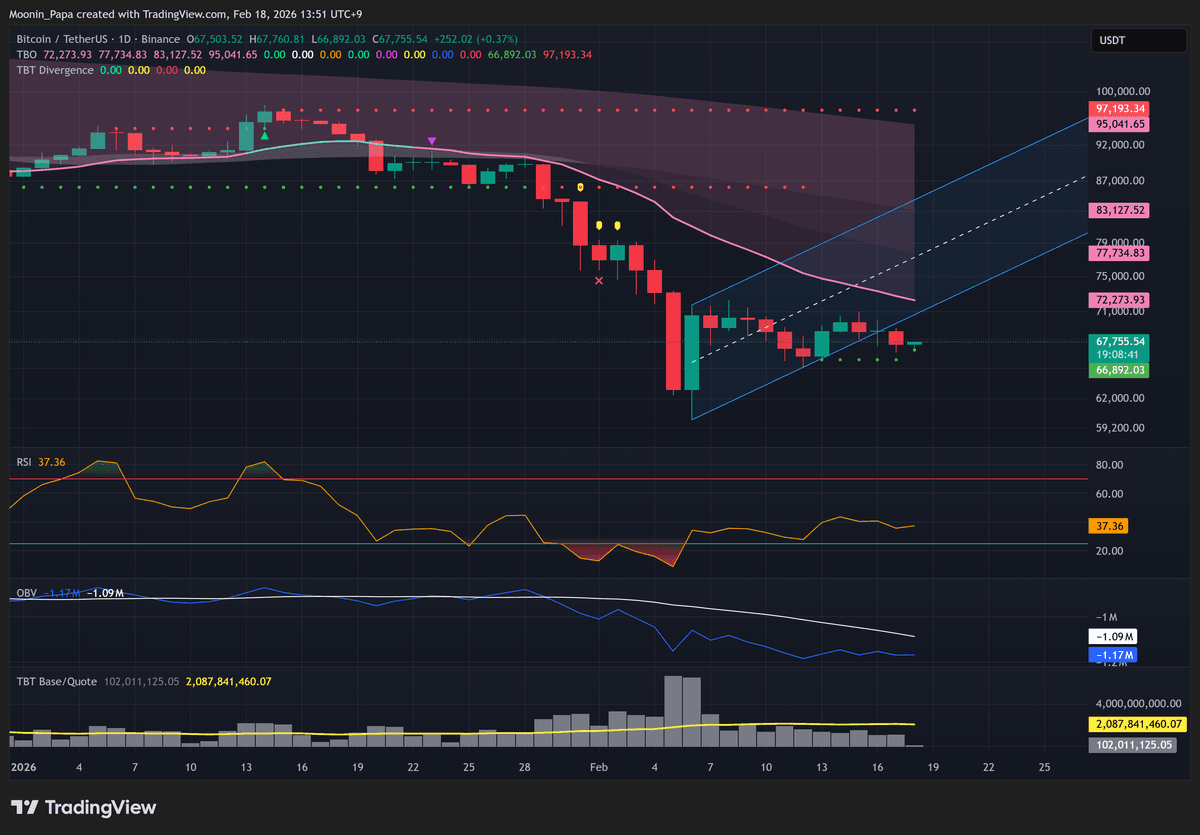
Bitcoin has broken short-term support within its parallel “bear flag” channel and looks set to test a lower low near $65,000–$63,000 before mounting a meaningful rebound. Short-term momentum remains negative, and a sustained bounce will require reclaiming key trendline support.
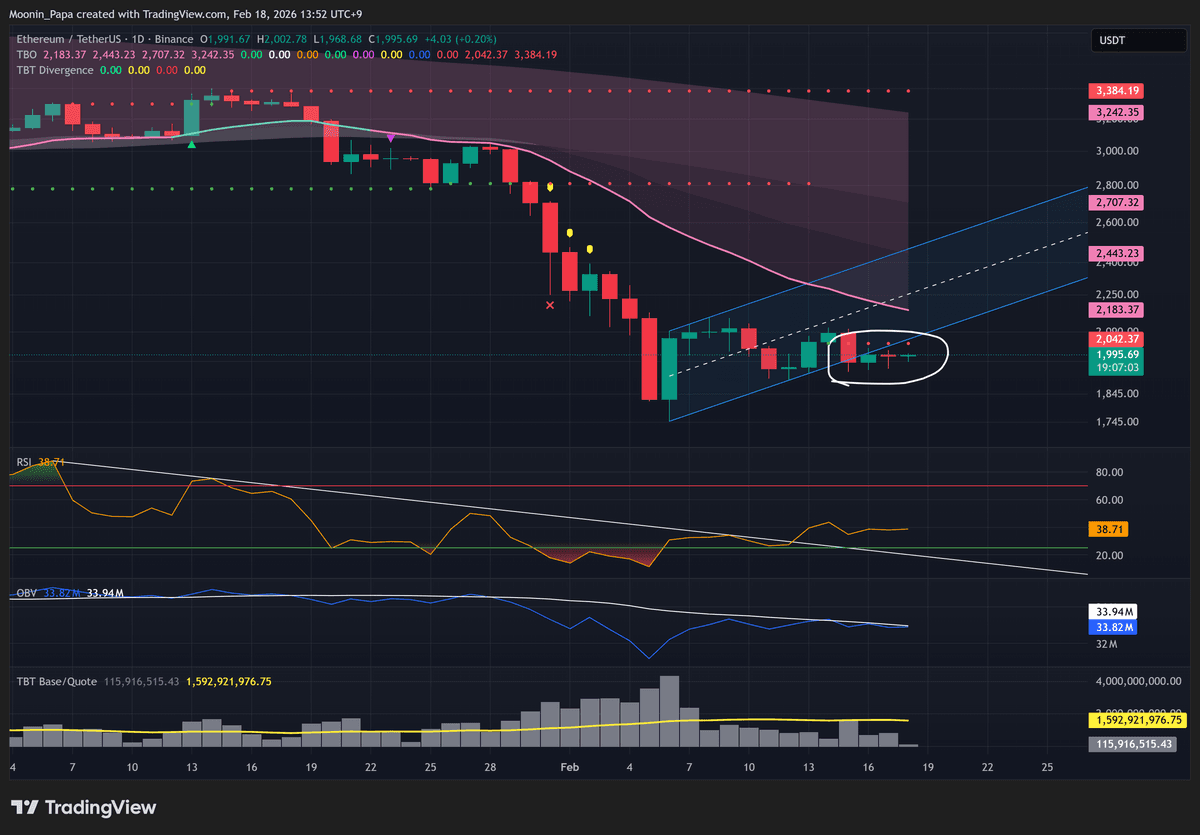
Ethereum is showing a similar pattern, with its price action mirroring Bitcoin’s pending lower-low setup. Traders should monitor ETH’s channel support and potential volume spikes for clues to an oversold swing.

Stablecoin Dominance and On-Chain Indicators
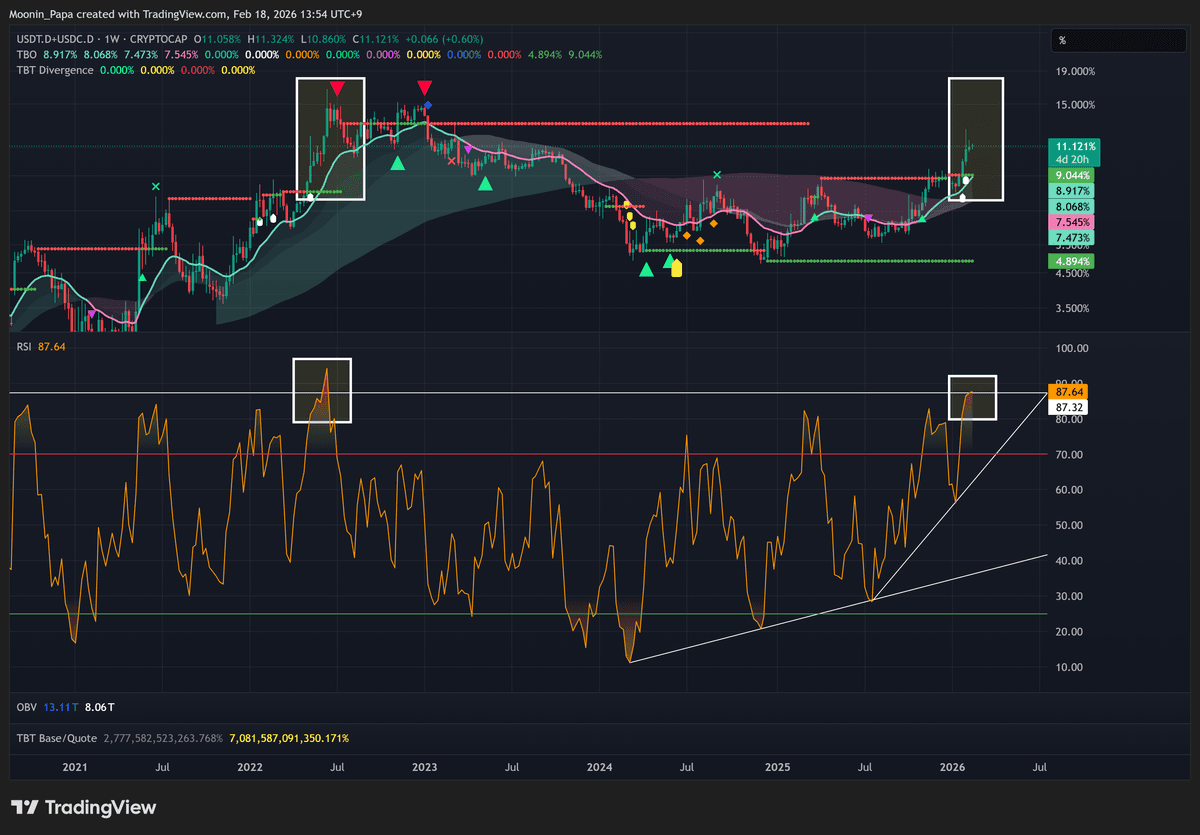
Combined stablecoin dominance remains firmly bullish, with the next TBO resistance at 11.518% well above current levels. The daily RSI has cleared near-term overhead resistance, though it is too early to confirm a breakout.
On the weekly chart, stablecoin dominance RSI sits at 87.32—matching June 2022 readings immediately prior to Bitcoin’s final capitulation down to around $35,000. While this suggests we may be closer to a crypto market bottom than many expect, most on-chain metrics have yet to reach true capitulation zones, implying continued chop and sideways action before a decisive dump.
Market Capitalization and Dominance Metrics
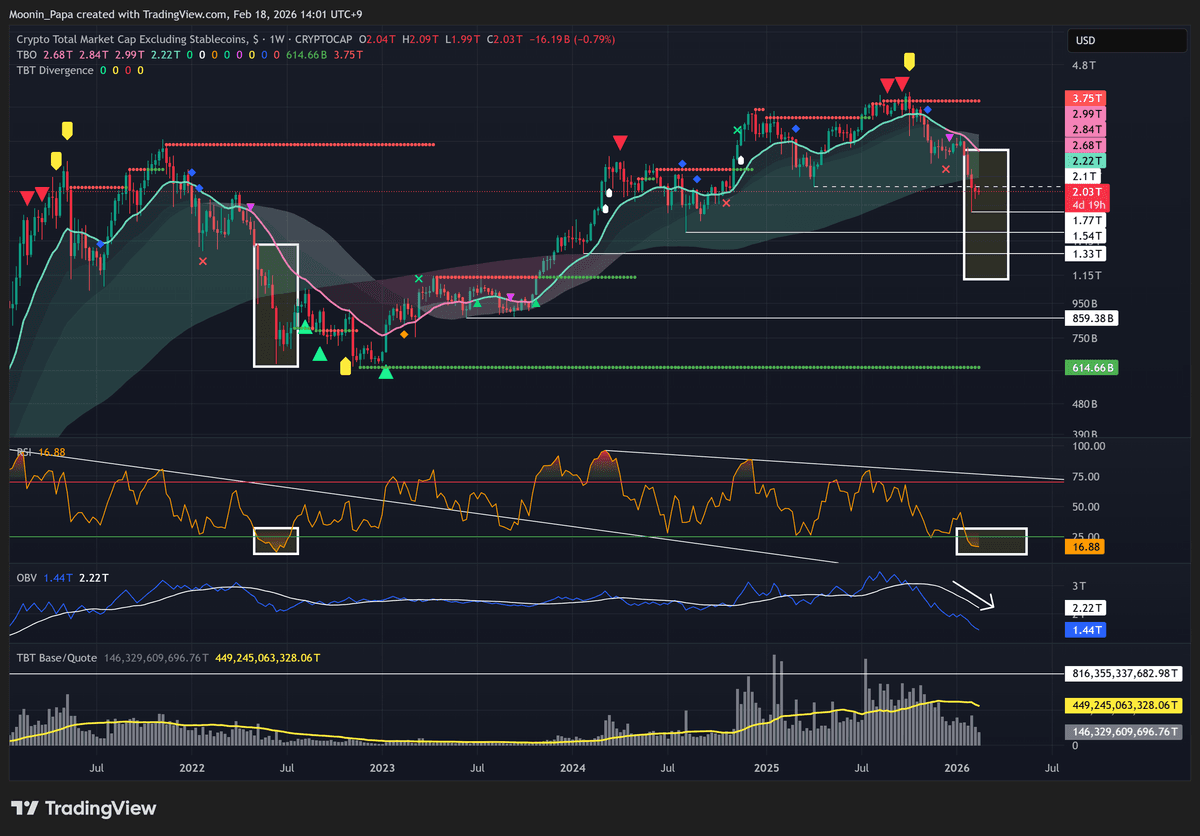
Bitcoin dominance (BTC.D) is weakening but remains surprisingly firm at 58%, a level usually seen before broader market crashes. Altcoin dominance (OTHERS.D) appears to show strength but lacks real conviction, while total crypto market dominance (TOTALES.D) is exhibiting a second TBT bullish divergence on the daily chart—though five prior signals in November–December yielded no sustained rallies.
TOTALE50.D’s 4-hour chart printed a TBT bearish divergence after a recent pump, and the weekly TOTALES RSI is deeply oversold, echoing mid-2022 conditions. Other major altcoin segments also display drawdowns post-capitulation, and pair charts like OTHERS/BTC are forming lower RSI highs. A final dump is likely before true market bottoming.
Traditional Financial Markets Update
The US Dollar Index (DXY) is recovering toward the daily TBO Cloud with no clear reversal signals yet. USD/JPY holds at historical support/resistance, although on-balance volume is weakening and volume is drying up.
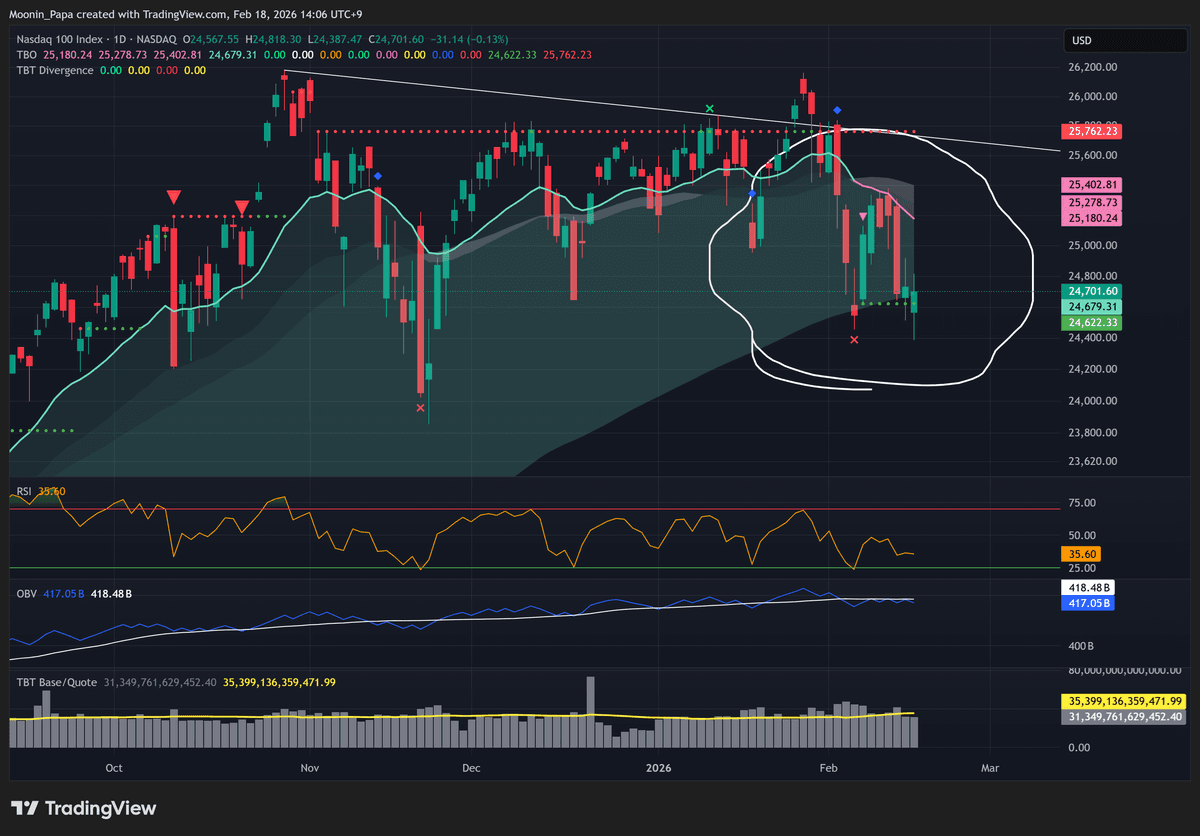
S&P 500 futures remain in a daily TBO Cloud “bearish consolidation” and may face a deeper 25% pullback. The Nasdaq 100 (NDX) briefly traded below its TBO Cloud before closing inside, while the FANG index continues lower. NVDA and TSLA are in sideways ranges with TBO Close Long warnings, and the VIX spiked into its rejection zone, likely signaling higher volatility ahead.
Commodities and Asian Markets Snapshot
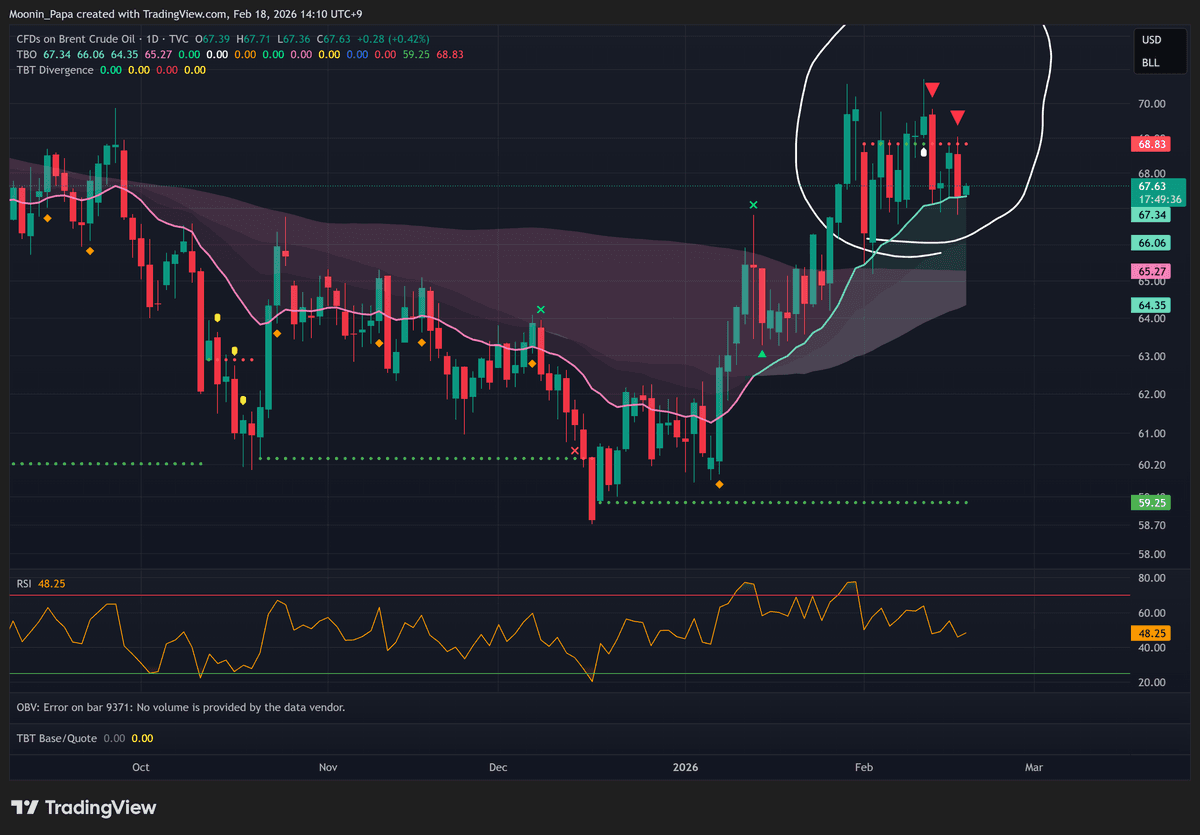
In Asia, the Nikkei is extending to higher highs, whereas the Hang Seng struggles to reclaim its daily TBO Cloud. Brent crude oil printed a second TBT bearish divergence, suggesting a forthcoming pullback.
Gold has slipped into its daily TBO Cloud, indicating ongoing bearish consolidation, and silver remains under pressure with no clear relief rally in sight.
Altcoin Highlights
HYPE is capping beneath overhead resistance and losing momentum, while HBAR shows declining volume and an RSI roll-over inside its daily TBO Cloud. ASTER is faltering after recent gains, and SKY’s TBO Close Long signal warns of a reversal.
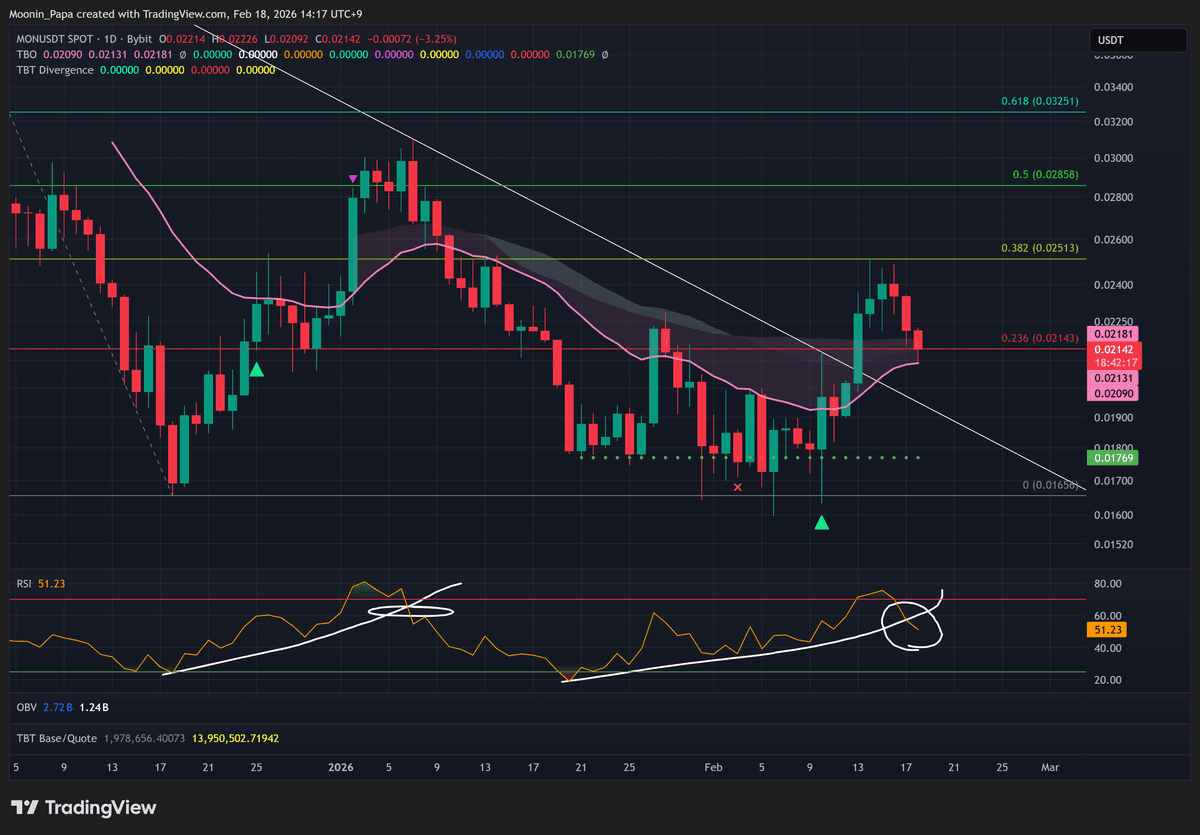
MYX has plunged nearly 80% this week, RIVER lost support and is down 24%, and PIPPIN and MON both fell over 30% amid weakening trends. MORPHO’s move to the cloud summit merits caution, and HNT appears poised to follow its peers lower. Until a clear capitulation event unfolds, patience remains essential for dip buyers.
Learn my strategies and the tools I use every day by visiting The Complete Cryptocurrency Investor by Mastering Assets.
