

Bitcoin Price Action and Bear Flag Setup
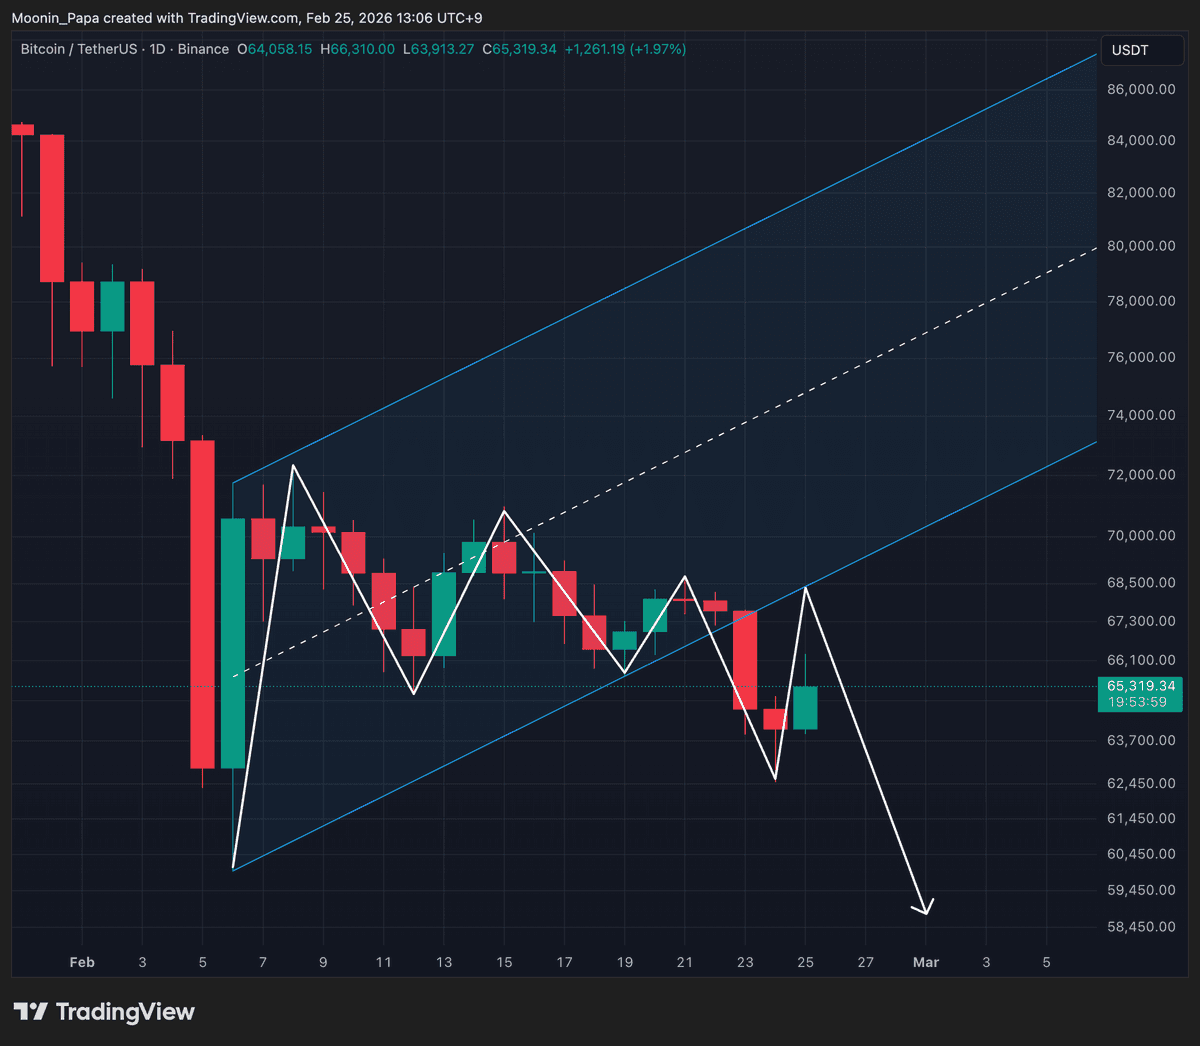
Bitcoin formed a low at $62,510, aligning with expectations for a $63,000 test and prompting a reassessment of its current bear flag. If the pattern remains intact, we anticipate a rally to retest the fallen support level—now resistance—before a potential descent toward $49,000. Alternatively, this recent trough may represent the pivot low of a genuine bear flag, which could signal a change in market structure if confirmed.
Volume-based indicators, including the TBO, OBV, and daily volume metrics, remain firmly bearish. Despite a brief uptick in price—potentially linked to ongoing market-maker investigations—there is no clear technical evidence of a sustained bullish reversal at this stage.
Ethereum, Dominance Metrics, and Sector Indices
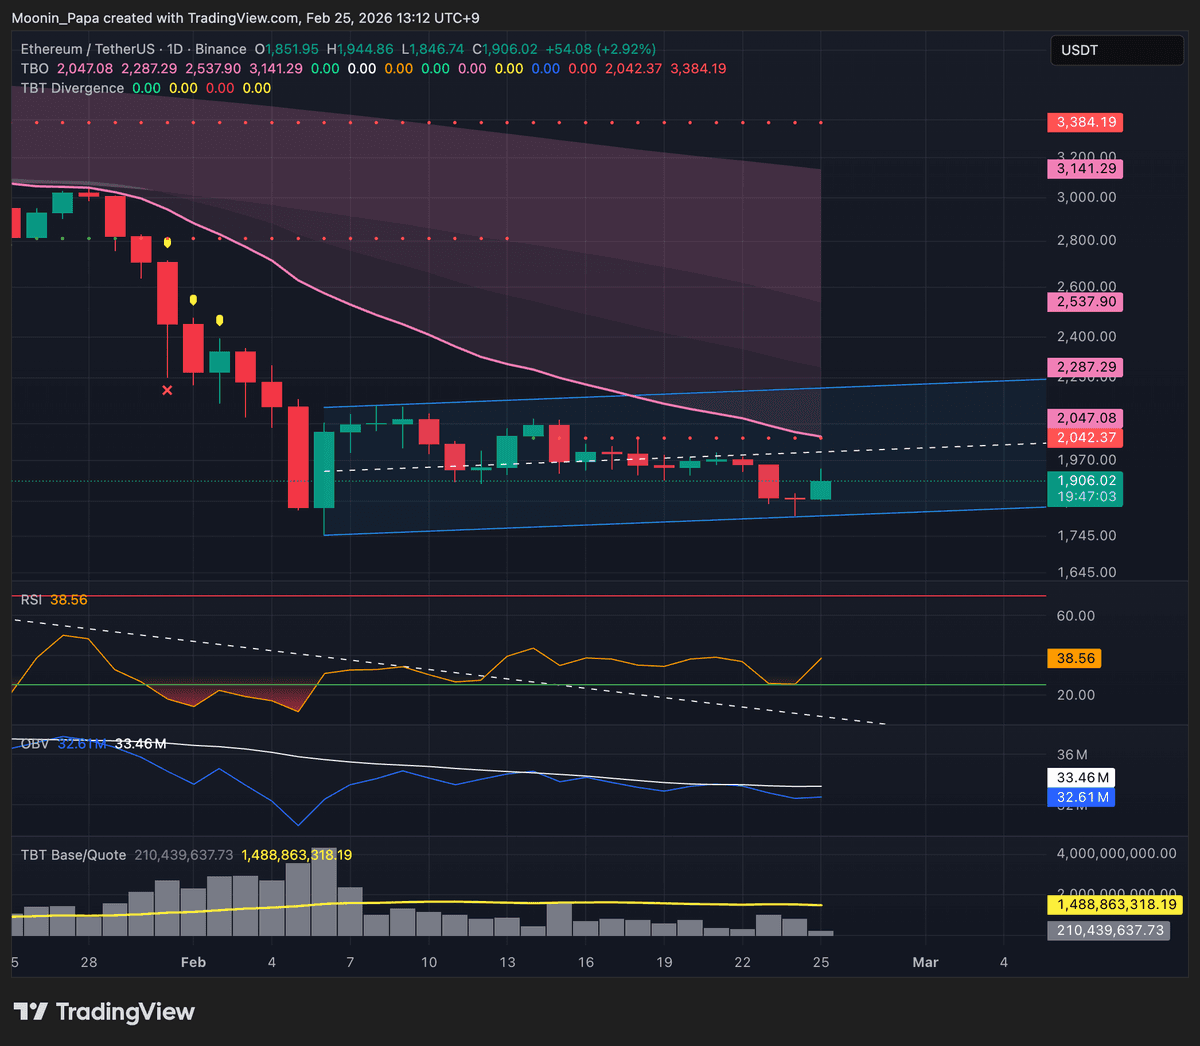
Ethereum registered a new low at $1,800, reinforcing its own bear flag formation. Both BTC and ETH may attempt another test of their daily TBO Fast lines, but further capitulation is expected before any durable recovery. Stablecoin dominance remains strongly bullish above the daily TBO Cloud, with RSI sliding from 75.67 to 62.51, indicating a reduction in overbought conditions.
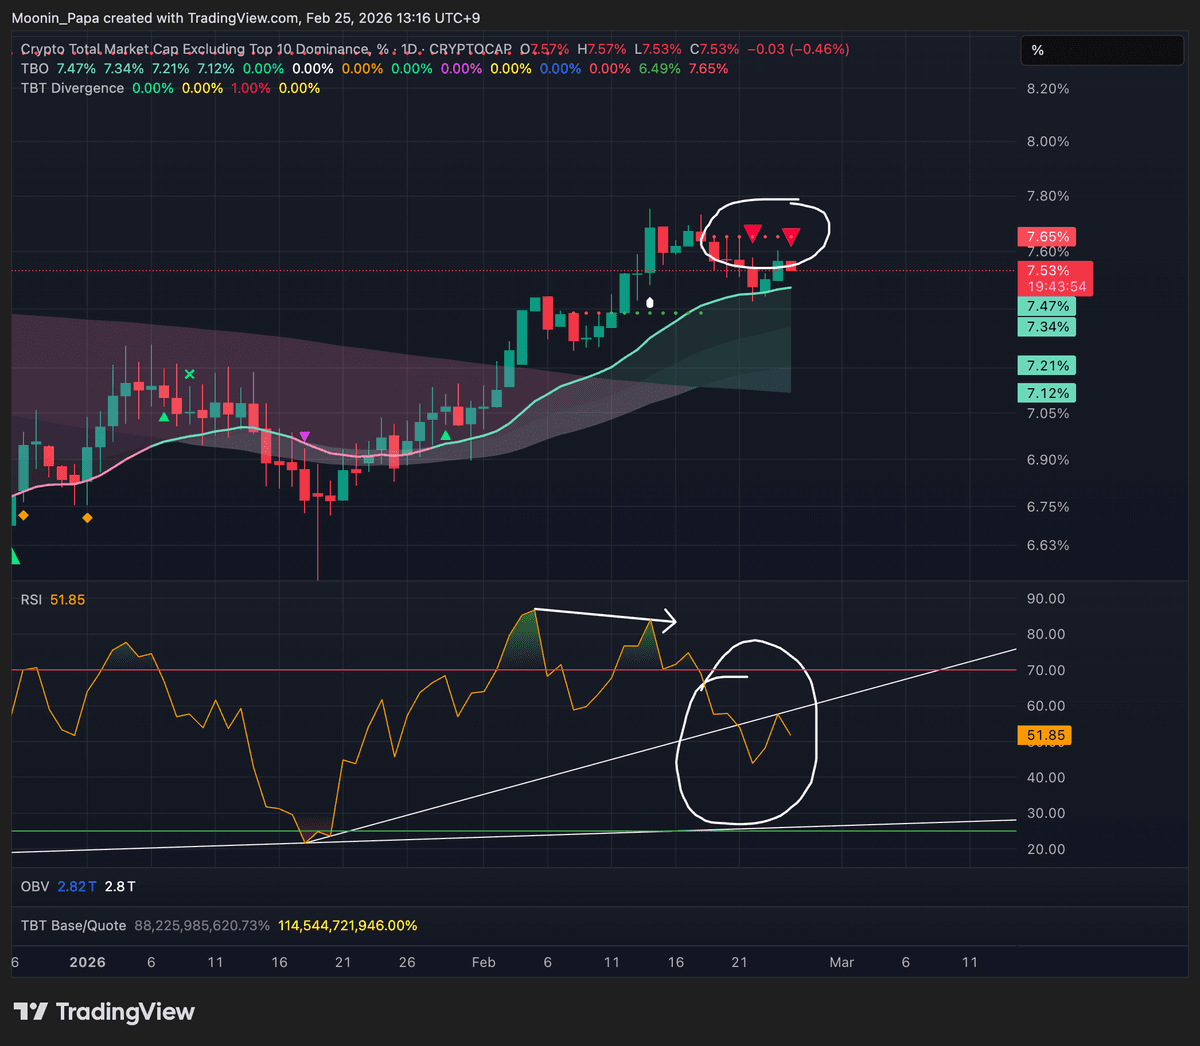
By contrast, Bitcoin dominance is still bearish below the daily TBO Cloud with no significant shifts evident. The OTHERS.D index is poised to print a second TBT Bearish Divergence on its daily chart, as RSI lost and then rejected its support level. On the four-hour timeframe, a TBO Breakdown Cluster highlights further downside risk pending Bitcoin’s ultimate capitulation.

Traditional Finance and Macro Signals
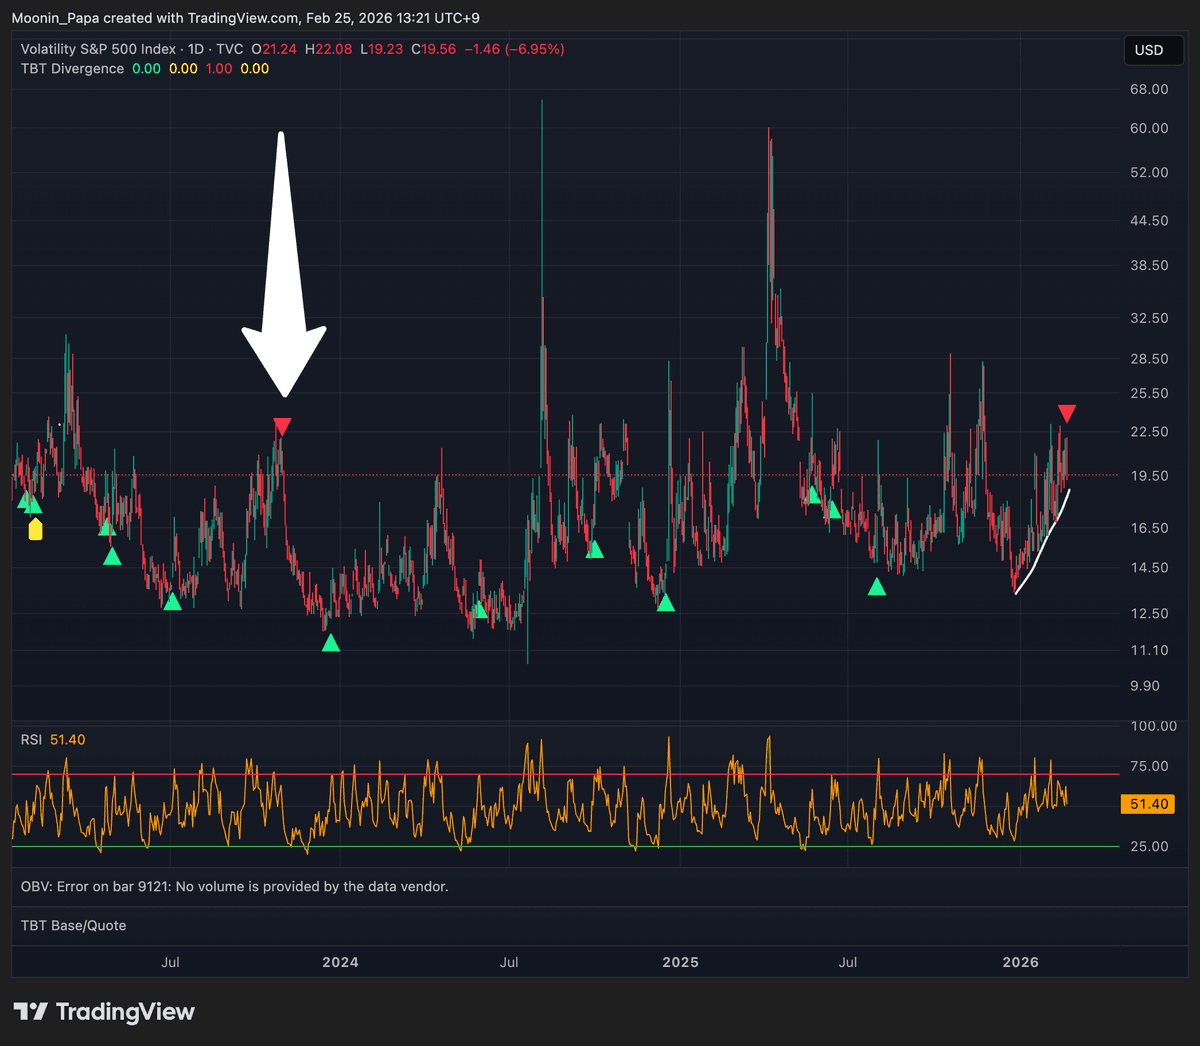
The U.S. Dollar Index confirmed its second TBO Close Short signal, suggesting a potential move above the 100 level toward resistance at 100.261. S&P 500 futures also registered a TBO Open Short earlier this week, though an unexpected TBT Bearish Divergence on the VIX daily chart—which last appeared in October 2023—introduces uncertainty, as that prior signal marked the S&P’s cyclical bottom.
International equities remain mixed: Japan’s Nikkei approaches its 2.0 Fibonacci extension at 59,450, while the Shanghai Composite continues its advance. Crude oil (UKOIL) maintains valid TBO breakouts, though momentum has yet to translate into sustained price moves.
Metals and Commodities Outlook
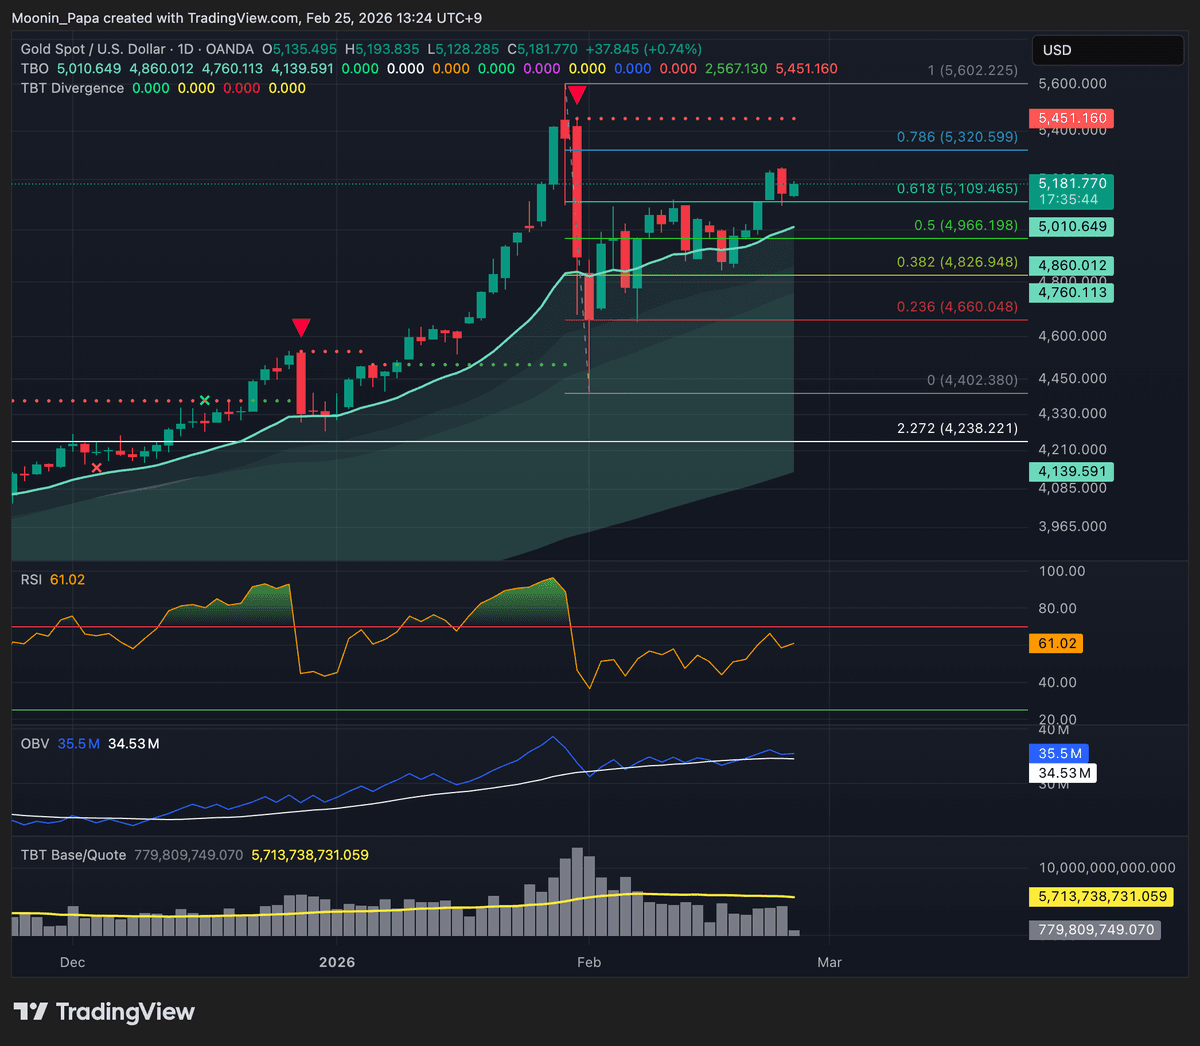
Gold retraced to its 0.618 Fibonacci level but remains on track to reach 6,500 by year-end. Silver has broken above its 0.5 Fibonacci level, exhibiting renewed bullish strength, a pattern mirrored in platinum and copper. Uranium is positioning for a push to TBO resistance at 7,974, reflecting broad-based commodity strength amid ongoing macro uncertainty.
Altcoin Market Sentiment and Outlook
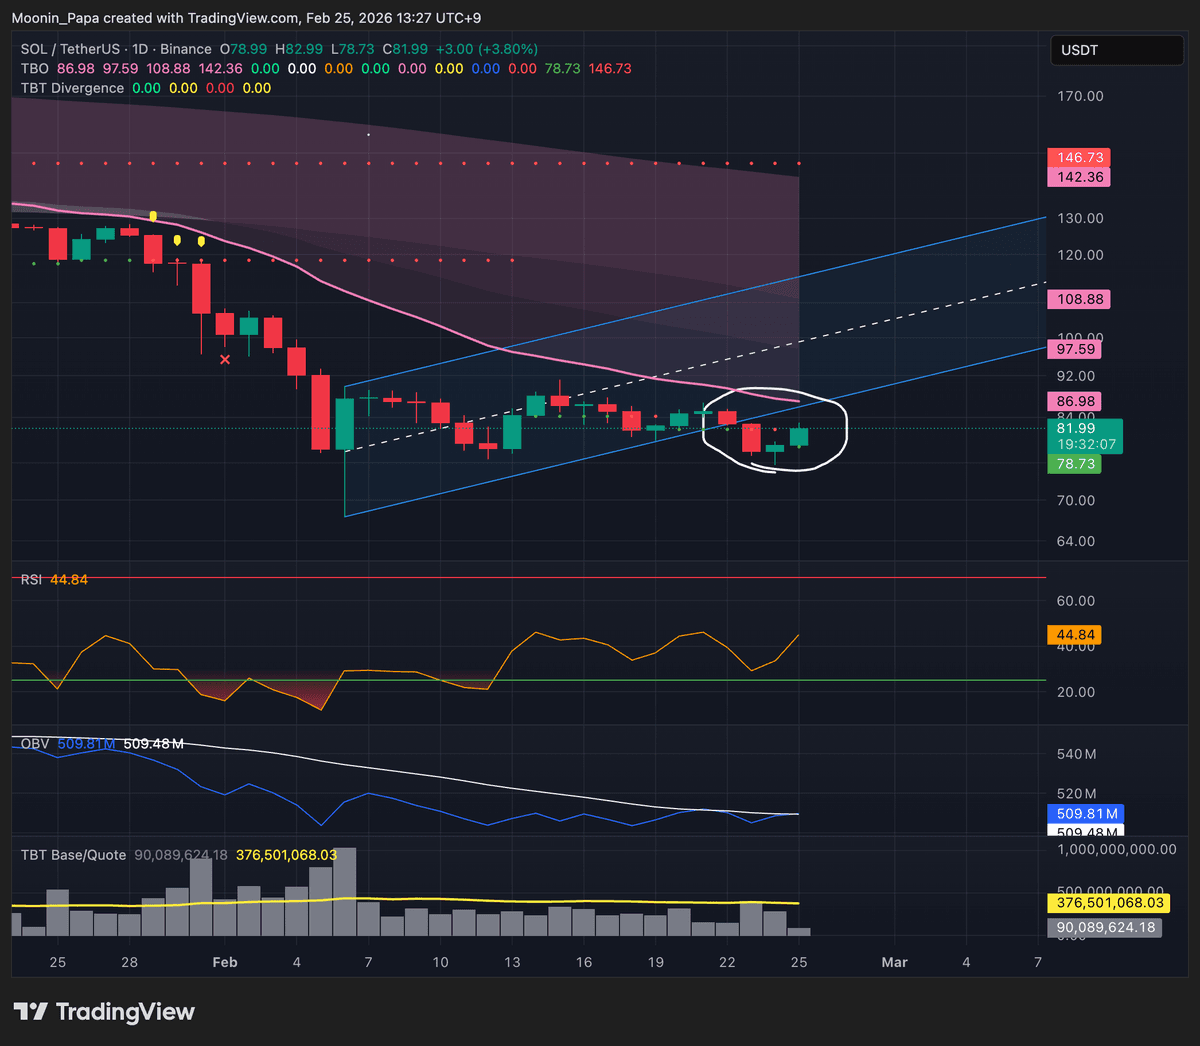
Altcoins await a relief rally, but the overarching bearish trend in Bitcoin suggests any significant run in smaller tokens may prove short-lived. SOL appears to be validating a bear flag with a retest and subsequent rejection of former support. LINK’s four-hour chart exhibits TBO breakdowns followed by rebounds to the fast line, which historically precede deeper declines.
MYX continues its downward trajectory, though daily volume is tapering—potentially signaling waning selling pressure and a setup for reversal. PIPPIN displayed a daily TBO breakout, yet RSI failed to exceed previous highs, indicating limited follow-through. Overall, while a temporary bounce is possible, the risk of a bull trap persists until Bitcoin confirms a capitulation low.
Learn my strategies and the tools I use every day by visiting The Complete Cryptocurrency Investor by Mastering Assets.
