

Bitcoin Technical Analysis
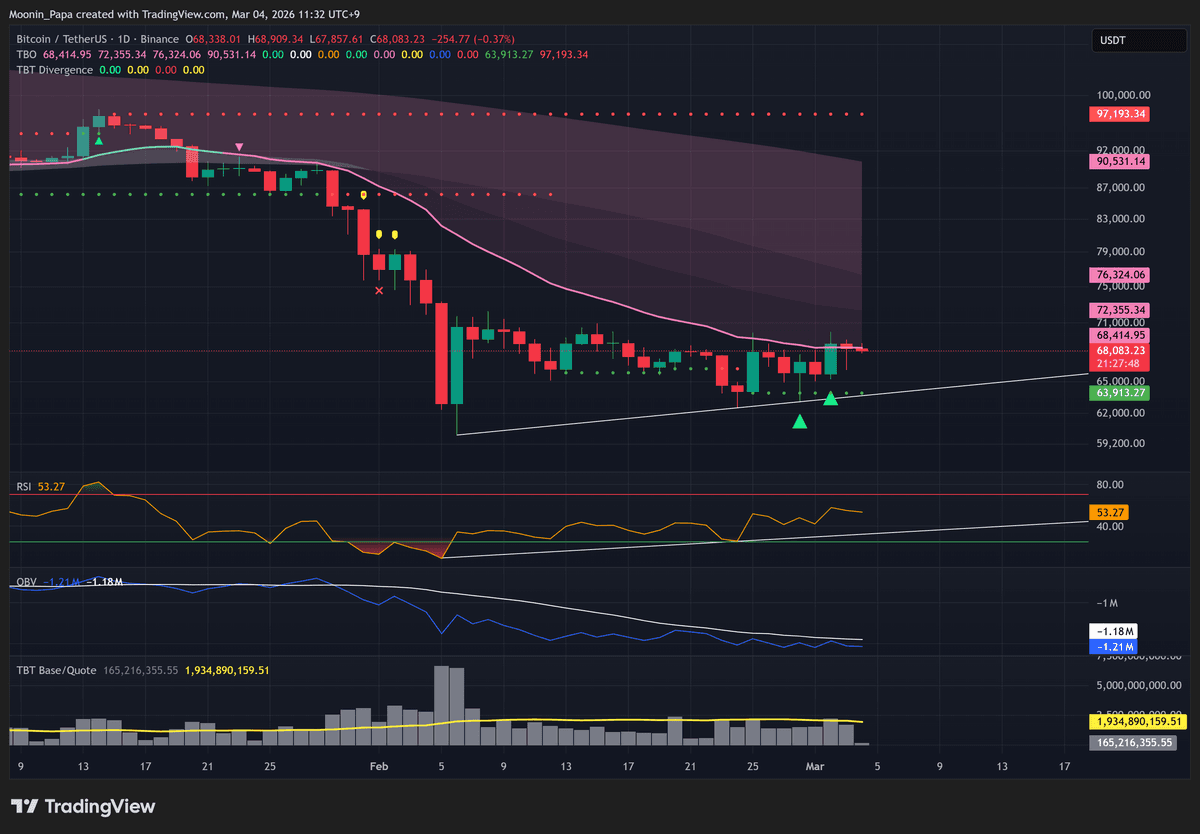
Bitcoin’s daily close inside the TBO Cloud underscores persistent bearish momentum despite two recent TBT bullish divergences. Daily TBO, OBV and volume readings remain negative, and while the weekly RSI may attempt a reset above 25, the absence of firm support suggests the market bottom is not yet established. Notably, daily RSI is forming lower highs and lows even as the TBO Slow line stays bullish, indicating the macro trend still favors downside continuation and potential “pain” for long positions.
Ethereum and Stablecoin Dynamics
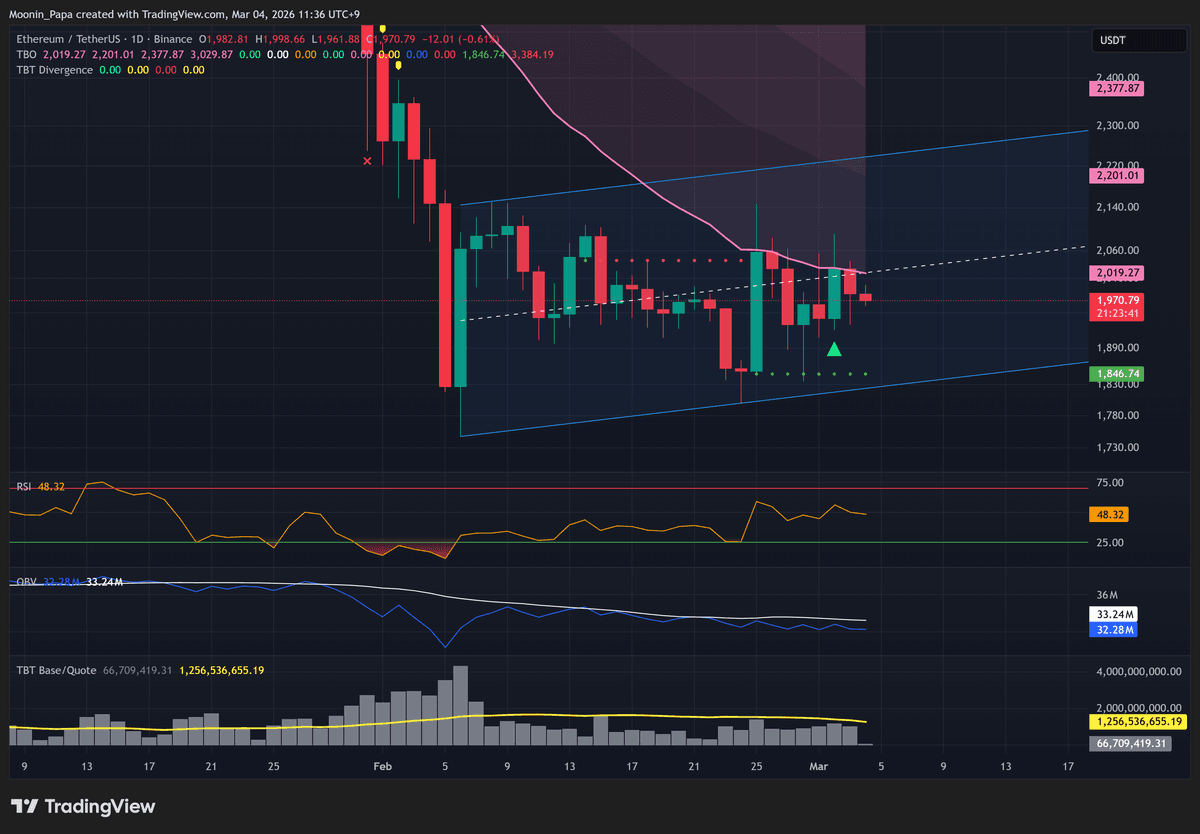
Ethereum continues to struggle at the daily TBO Fast line, repeatedly tagging this resistance without daily close confirmations, preserving a strong bearish tilt. Meanwhile, combined stablecoin dominance remains above the daily TBO Cloud—traditionally bullish—but recent pierces into the Cloud signal a shift toward bearish consolidation, raising the risk of further declines if this support gives way.

Crypto Dominance Metrics and Total Market Cap

Bitcoin dominance (BTC.D) briefly broke above short-term resistance on Monday, printing a TBO Close Short and a TBT bullish divergence, yet remains entrenched in daily cloud consolidation. A fall below $60,000 BTC price could drive BTC.D under 57%. Top 10 dominance mirrors November’s pattern but with a sharply declining TBO Slow line, underscoring a strong bearish trend despite a third TBT bullish divergence cluster. Other currencies (OTHERS.D) are likewise in bearish consolidation, and the TOTALES market cap chart exhibits pronounced bearish momentum, with weekly RSI and OBV still trending down.
Traditional Finance: FX, Oil, and US Equities
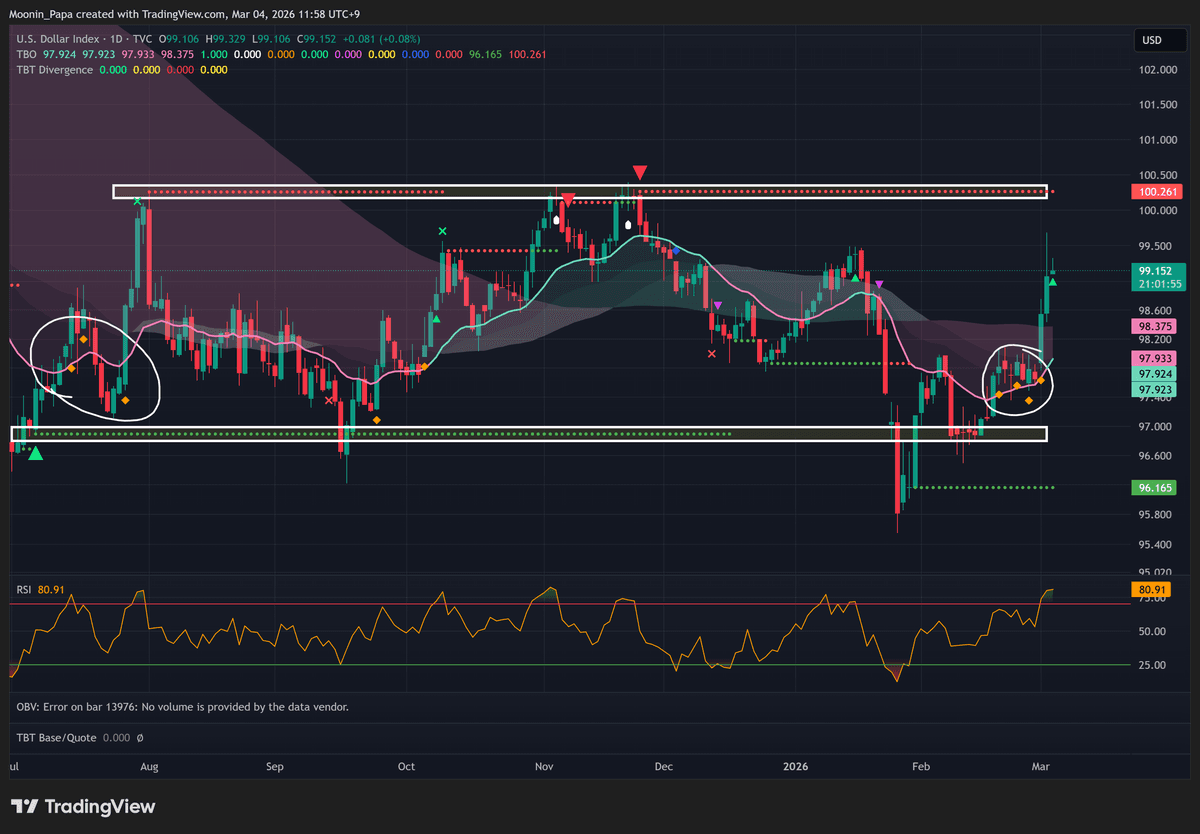
The US dollar index (DXY) is advancing toward daily TBO resistance at 100.261, typically weighing on S&P, Nasdaq and Dow Jones. The euro and yen are both strongly bearish relative to their TBO Clouds, with the yen’s decline threatening BoJ intervention via USD bond sales. Crude oil (UKOIL) has surged above TBO resistance to $82.33 amid Middle East supply concerns. Gold pulled back 4.38%, forming a TBT bearish divergence yet remains in a broader uptrend near the daily TBO Fast line. Silver underperformed gold, highlighting unexpected volatility in safe-haven metals.
US Equity Markets
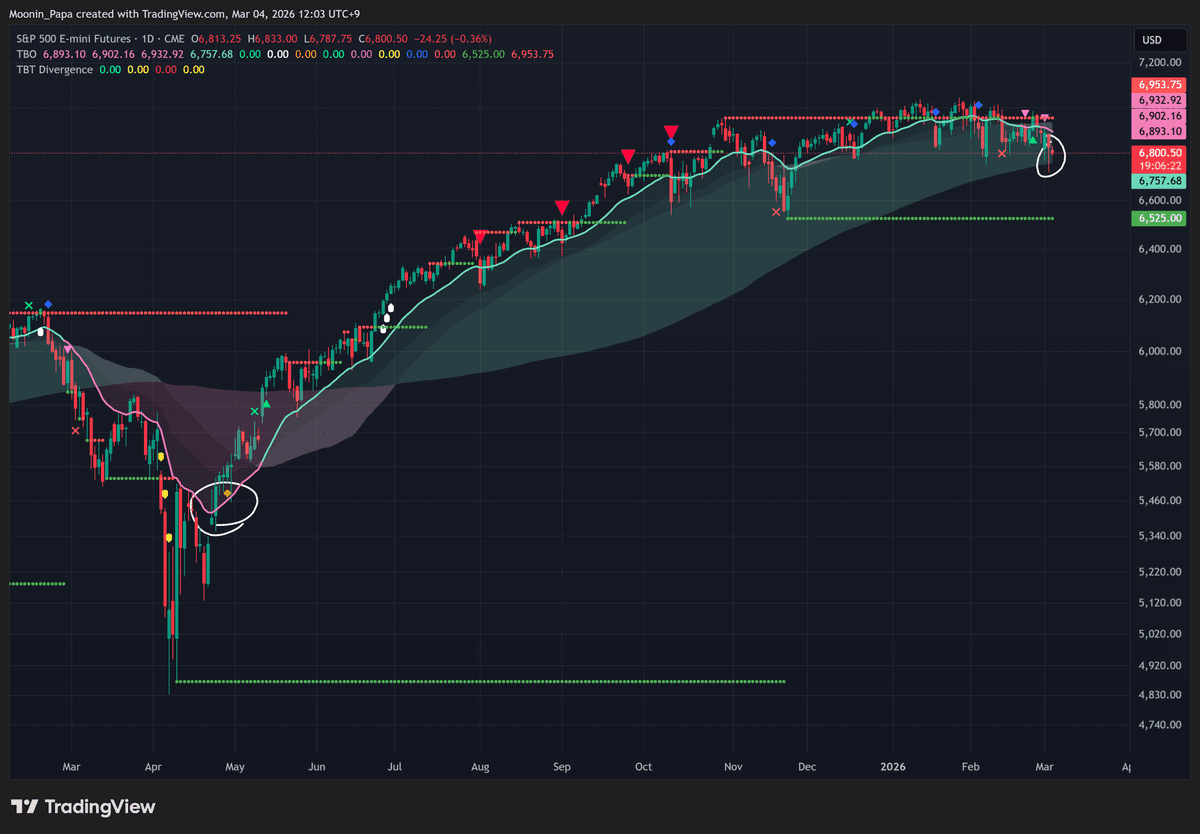
S&P futures wicked below the daily TBO Cloud for the first time since April 2025, signaling an imminent shift to strong bearish if a close below the cloud occurs. The weekly ES1! chart sits inside its TBO Cloud in consolidation, with RSI and OBV both bearish and a downside target near the weekly TBO Slow line around 5,888. The Dow printed a sharply bearish daily candle and has pierced its weekly cloud for the first time since May 2025. The Nasdaq (NDX) is now in strong bearish territory, opening and closing below its daily cloud; NVDA and TSLA mirror this weakness, while the VIX has spiked to 28.15.
Asian Markets

The Nikkei is down roughly 9% this week after failing at the 2.0 Fib extension, printing a TBO Close Long setup amid high selling volume; its weekly chart shows a TBT bearish divergence and declining RSI. The Shanghai Composite’s weekly bearish divergence and lower RSI highs signal further downside, despite a second daily TBO Close Long. The Hang Seng plunged over 6% this week, setting up another TBO Close Long—the last two occurrences in July 2021 preceded a 44% slide.
Learn my strategies and the tools I use every day by visiting The Complete Cryptocurrency Investor by Mastering Assets.
