
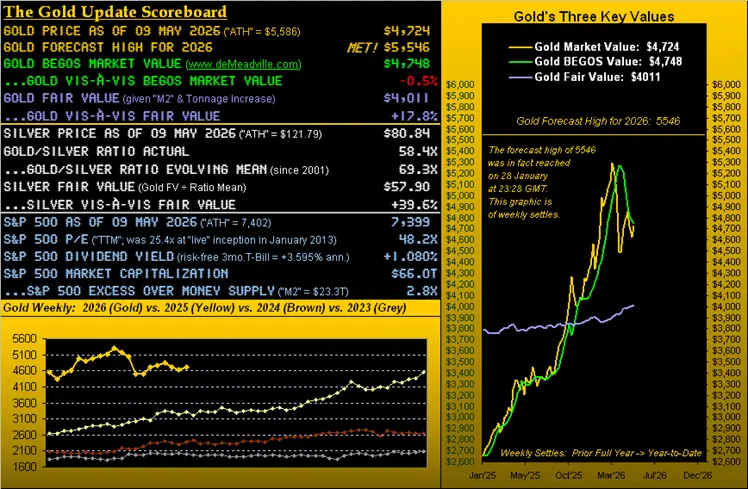
The lower Gold levels we’d anticipated two weeks ago (price having dropped from our 25 April penning at 4725 by as much as -4.6% to 4510 this past Monday) clearly panned out. Since that low, Gold has recovered all of such loss and then some, climbing on Thursday to as high as 4775 in settling the week yesterday (Friday) at 4724. And by the above Scoreboard, the combination of Gold recovering contra to its declining BEGOS Market Value* (now 4748) puts those two levels relatively near one another. As we oft quip: “Means reversion is a beautiful thAng”. However (as also therein depicted), given Gold’s Fair Value (now 4011), price remains notably overvalued by +17.8%.
*Gold’s value based on its movement relative to those of BEGOS: Bond, Euro, Gold, Oil, S&P 500
Still, per our title’s query: is Gold in just a relief rally, or did the recent downtrend reach its finale? Let’s have a look. Et voilà, our latest view, along with that for Silver too, their respective pink 21-day linear regression trends still negatively skewed. Cue Edith Piaf from ’45:  “La Vie en Rose”

‘Course (save for those WestPalmBeachers down there), market participants know ’tis the tendency of technicals to lag price. And those trendlines for Gold and Silver are losing their downside consistency because the baby blue dots — at least for the past three trading days — are on the rise. As these “Baby Blues” tend to lead price, we may see such trends rotate from negative to positive over the next week or two, (the blue dots then having crossed back above their respective 0% axes).
But wait, there’s more: let’s go to the Market Magnets for both precious metals. Note the steely upside crossovers of price above Magnet. As described on the website: “…being ‘attracted’ to and crossing the Magnet, we expect price to continue in the same direction. But when the price gets too far away from the Magnet, we anticipate price to be re-attracted to the Magnet…” Cue Walter Egan with Stevie Nicks from ’78: “Magnet and Steel”

“So, mmb, because they’ve both just crossed, you think there’s more up to come?”
‘Tis the rule rather than exception, Squire. In looking at Gold’s lower-left panel wherein price is labeled as +80 points above the Magnet, the two prior peaks were upwards of +200 points; as for Sister Silver’s lower-right panel at +4.48 points, ’tis about the same distance as seen a month ago; however her February excursion ran toward +10 points higher.
“Ok that’s pretty cool, mmb, but by the weekly stuff, gold’s trend still is down…”
Squire, by Gold’s weekly bars and parabolic trends from a year ago-to-date, price just completed its eighth Short week per the rightmost red dots. But the good news is that through these last six weeks, Gold has been more contained, indeed trending sideways as opposed to downward:

Sideways notwithstanding, for Gold in the ensuing week to flip its parabolic trend from Short to Long, price need rise +493 points such as to eclipse the noted 5217 level. As of now, the expected weekly trading range is “only” 335 points, (last’s week’s actual range being “just” 265 points), and the daily 107 points. Thus barring the long-bankrupt U.S. Treasury actually acknowleding bankruptcy (or some other momentous market-moving event), Gold’s Short trend likely has more than a week before reaching its end, even should price continue to ascend.
Meanwhile: shall there ever be an end to the meteoric rise in the S&P 500? Our wariness is beyond extreme. ‘Round here, the high-level finance folks with whom we’re humbly honoured to engage all ‘know’ that “The Crash!” is coming. (‘Tis been re-hashed time and again now for some three years). Regardless, recall in our 18 April missive that for the S&P’s practically non-existent dividend yield to match that of the annualized three-month U.S. T-Bill, the Index need decline -64%. (That won’t be on CNBS). And perhaps such demise is near, for as a fine friend the other day said: “It’s different now.” That thus stated, we’ve repetitively learned that ’tis never different.
To be sure, the S&P’s Q1 Earnings Season has exhibited excellent year-over-year growth; but as we’ve regularly underscored, the actual level of earnings remains too poor to maintain price, especially given more than triple the yield in the “risk-free” T-Bill.
So, here’s the quintessential question to pose for equities chasers in this Investing Age of Stoopid. The price of an investment into which you want to pile on along with all the lemmings is $48.20. Your trusty stockbroker tells you that if you buy today at that price, one year from now your value will be — including dividend yield — $49.72. Gonna buy it? Of course not. A +3.15% gain is boring! No. You want stocks that triple several times a year, ’cause that’s what everybody else has.
“Well, what exactly is that $48.20 stock, mmb?”
‘Tis not a stock, Squire. Rather, ’tis proportionally the “price” and “return” of the S&P 500 today. The price/earnings ratio settled this past week at 48.20x. That means you are willing to pay $48.20 for something that in a year shall earn $1.00, putting the price (per retained earnings) at $49.20. Add in the amazing yield of 1.080% for another 52¢ and there’s your all-in value a year hence of $49.72 … just in case you’re scoring at home.
Looking to gain even less? By the same proportional math for some specific S&P constituents, buying Tesla (TSLA) equates to paying $358 for something that earns $1. CoStar Group (CSGP)? $536 to gain $1. Or “How much is that doggie in the window?”–[Patti Page, ’53] Datadog (DDOG) $647 to earn $1. Then of course, one can do a full face-plant with CrowdStrike Holdings (CRDW) by paying an actual $528 for something that earns nothing. Have a great day. The Economic Barometer continues to have its share of them…

…albeit this past week was a bit of a mixed bag. 18 metrics came into the Baro, of which eight bettered the prior period, eight were worse, and two remained the same. March’s Factory Orders were the best of the bunch in beating both consensus and February, even as that month was revised higher. America is making stuff! Well sort of: the worst metric of the week was the first peek at Productivity for Q1, which missed consensus, was less than that for Q4, itself revised lower. Thus more “stuff” is being made less efficiently.
Wealth efficiency, however, is promoted by precious metals. And as to their respective “Nows”, next we’ve the 10-day Market Profiles for Gold at left and for Silver at right. This past week’s rallies moved prices up though resistance morphing such into support. For the yellow metal, down to 4691 looks safe, whereas for the white metal, shall the 80s hold? Let’s see how her new week from 80.84 unfolds:

We’ll wrap it here with this updated image from “A Picture is Worth a Thousand Words Dept.”, or in this case, perhaps just one word: “YIKES!”

Here’s a better word: “GOLD!”
Cheers!
