

Bitcoin repaired Monday's lower-wick volatility by closing inside its daily TBO Cloud, while Ethereum maintained the stronger structure. The recovery still leaves room for a final push, but overbought momentum, rising major-asset dominance, vulnerable equity charts, and selective ALT signals make profit protection the central theme.
Bitcoin recovers while its exit trigger draws closer
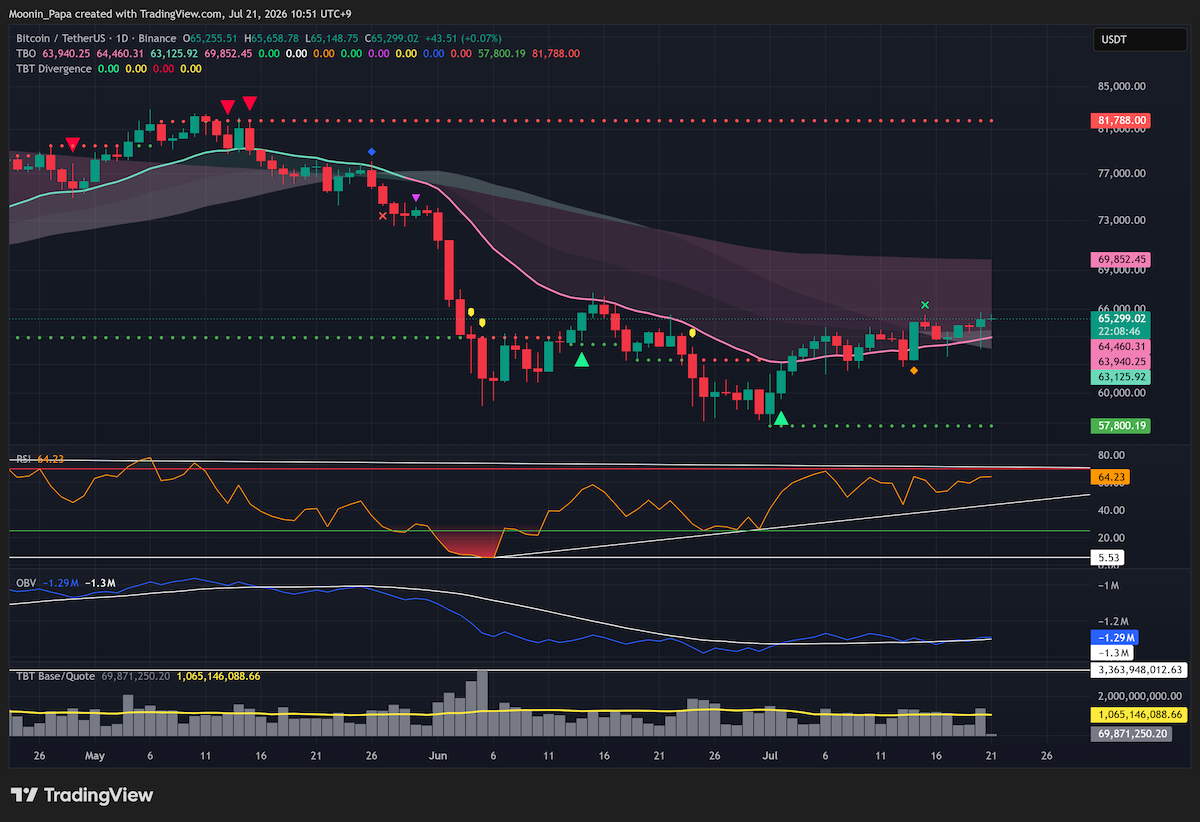
Bitcoin daily chart closing inside the TBO Cloud
Bitcoin pulled below the daily Cloud on Monday but recovered to close inside it. Monday's volume also helped OBV cross back above its white moving-average line, and daily RSI moved closer to 70. The source does not interpret the first four-hour TBO Breakout since early May as an immediate collapse signal.
The working path is a push toward $70,000, potentially aided by a short squeeze. The execution plan becomes defensive sooner: as Bitcoin approaches $69,000 and daily RSI reaches 70 or higher, the source plans to take profit from longs and pivot toward shorts.
Ethereum remains stronger but enters a scale-out zone
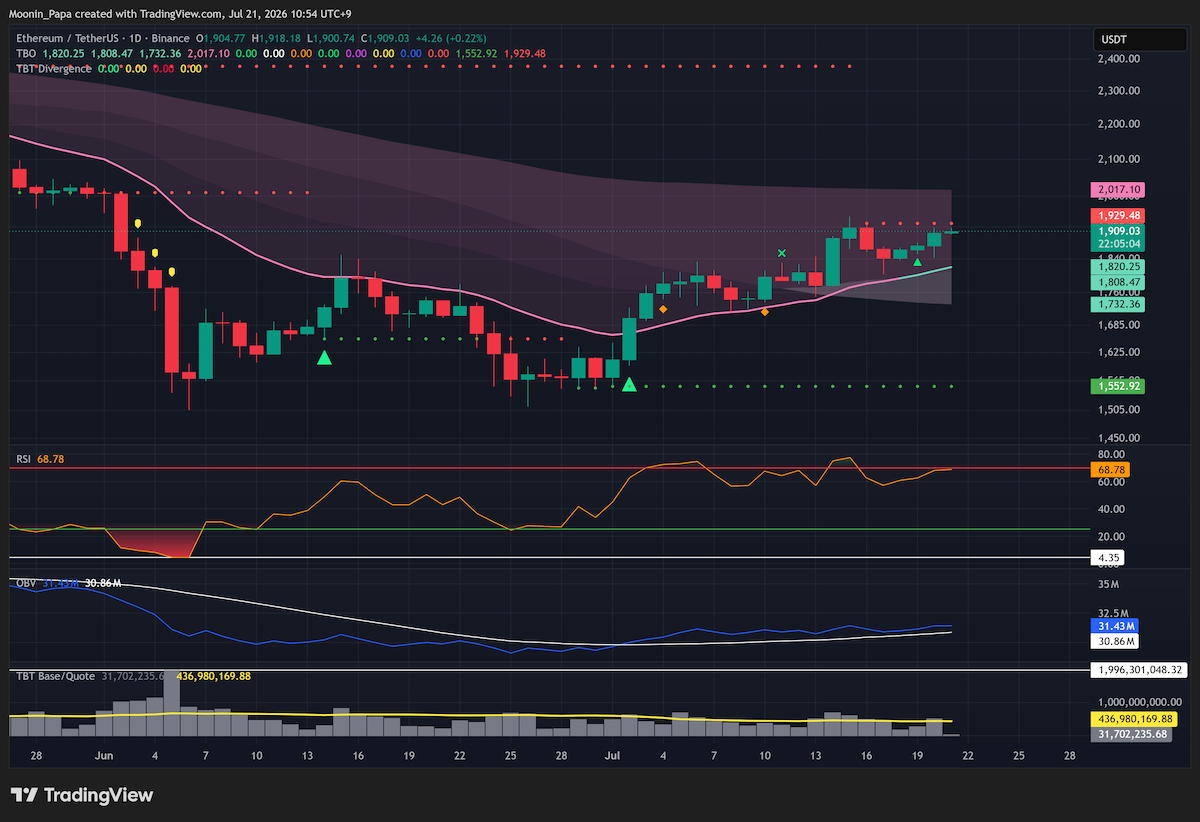
Ethereum daily chart after Monday's 1.74 percent close
Ethereum closed Monday up 1.74% without wicking below the Fast line, a clear contrast with Bitcoin's weaker structure. The source still allows for a move to $2,000 or $2,050.
That upside is framed as an opportunity to scale out of longs and consider shorts, not as a fresh chase. Ethereum has already recorded two overbought RSI readings this month, and the next overbought push is expected to be the last before a rollover.

Major-asset dominance leads before a possible ALT rotation
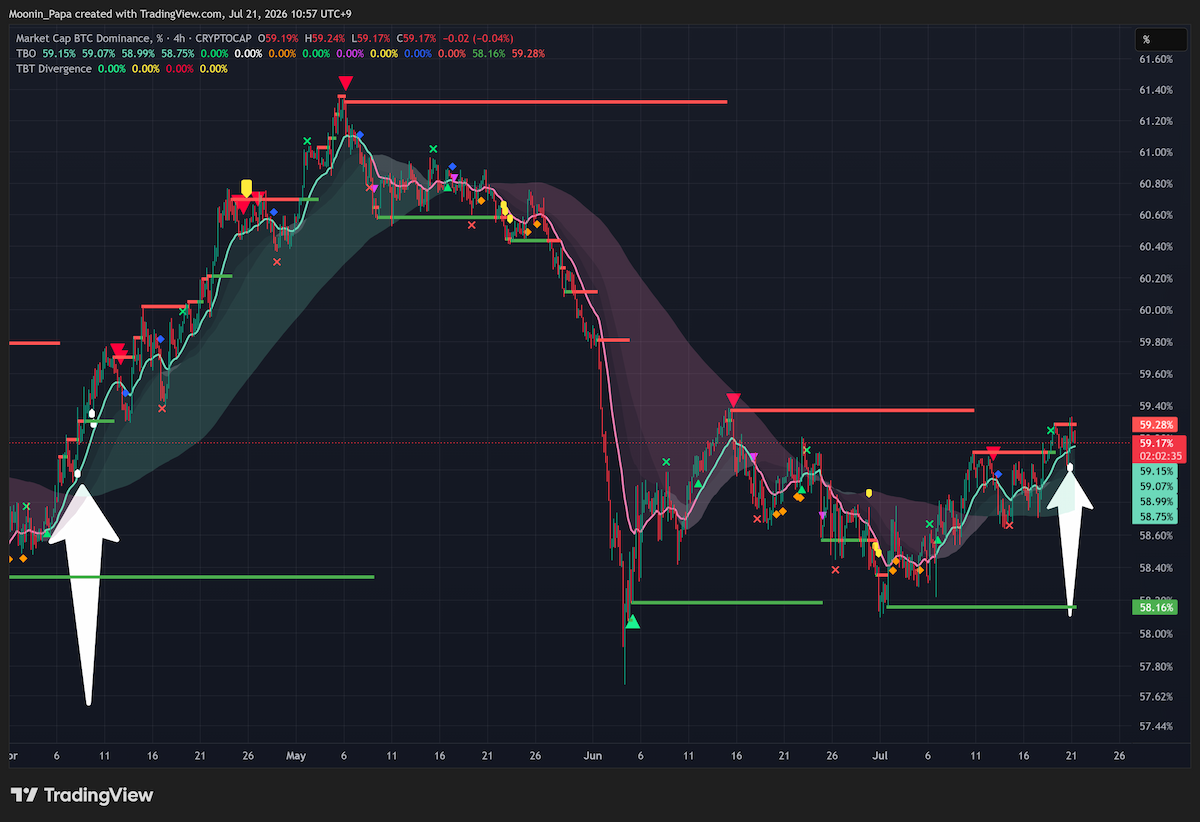
Bitcoin dominance four-hour TBO Breakout chart
BTC.D printed a four-hour TBO Breakout, its first such signal since early April. The source does not expect a repeat of the earlier move from 59% to above 61%, but a rising BTC.D would still pressure ALTs. ETH.D also moved above its daily Cloud with overbought RSI, reinforcing the case for protecting Ethereum profits.
BTC.D is Bitcoin dominance, not BTC spot price. SOL.D is Solana dominance, not SOL spot price. SOL.D closed more than 1% higher but remains in bearish consolidation inside its Cloud; its TBO Resistance is a dominance-chart exit marker, not a quoted SOL price level. Broader rotation may follow only after Bitcoin stabilizes.
Equity risk remains unresolved
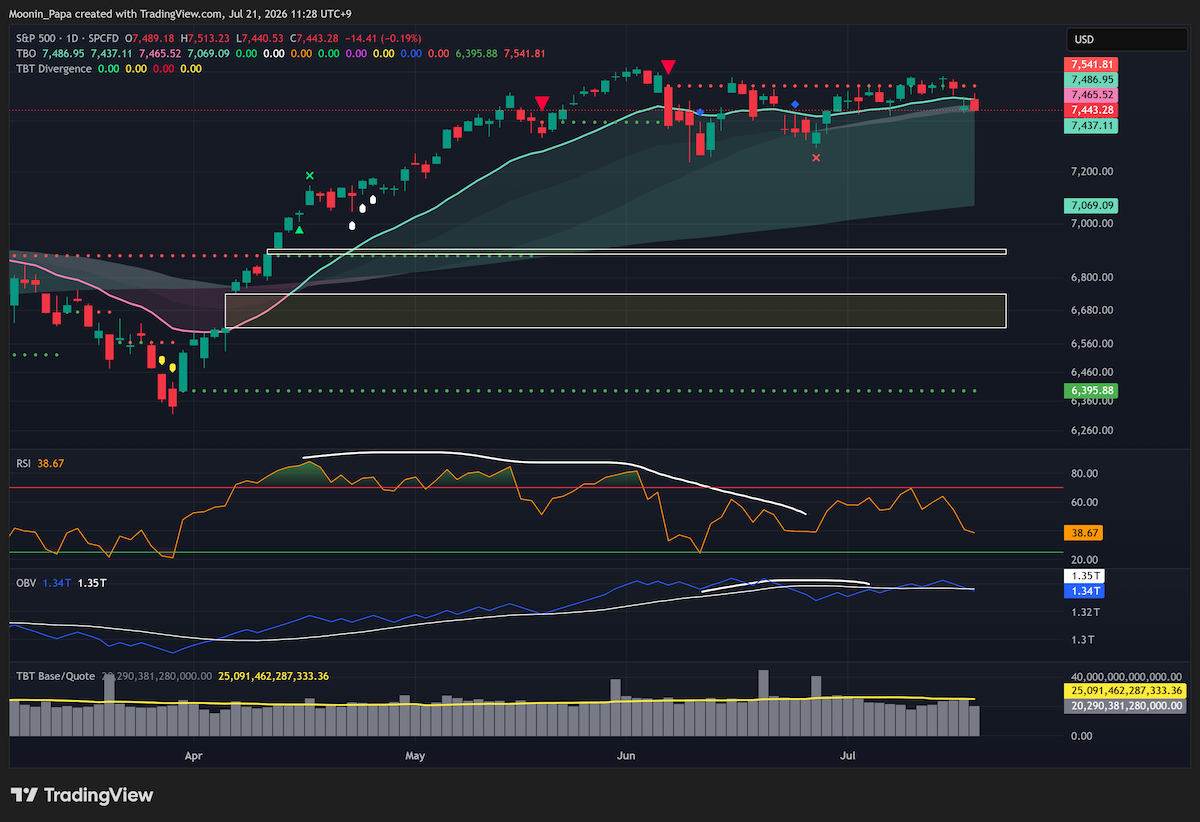
S&P 500 spot chart with two lower gaps
S&P futures remain in bearish consolidation inside the daily TBO Cloud, with bearish OBV and RSI around 41. The rising Slow line preserves an eventual buy-the-dip thesis, but the immediate structure remains vulnerable.
The SPX spot chart has two lower gaps extending to 6,618, which the source calculates as an 11% pullback. This is a spot-index chart and is separate from the S&P futures chart. TSLA added another warning by closing Monday down nearly 3% and breaking long-term support.
Gold and oil point to weaker commodity momentum
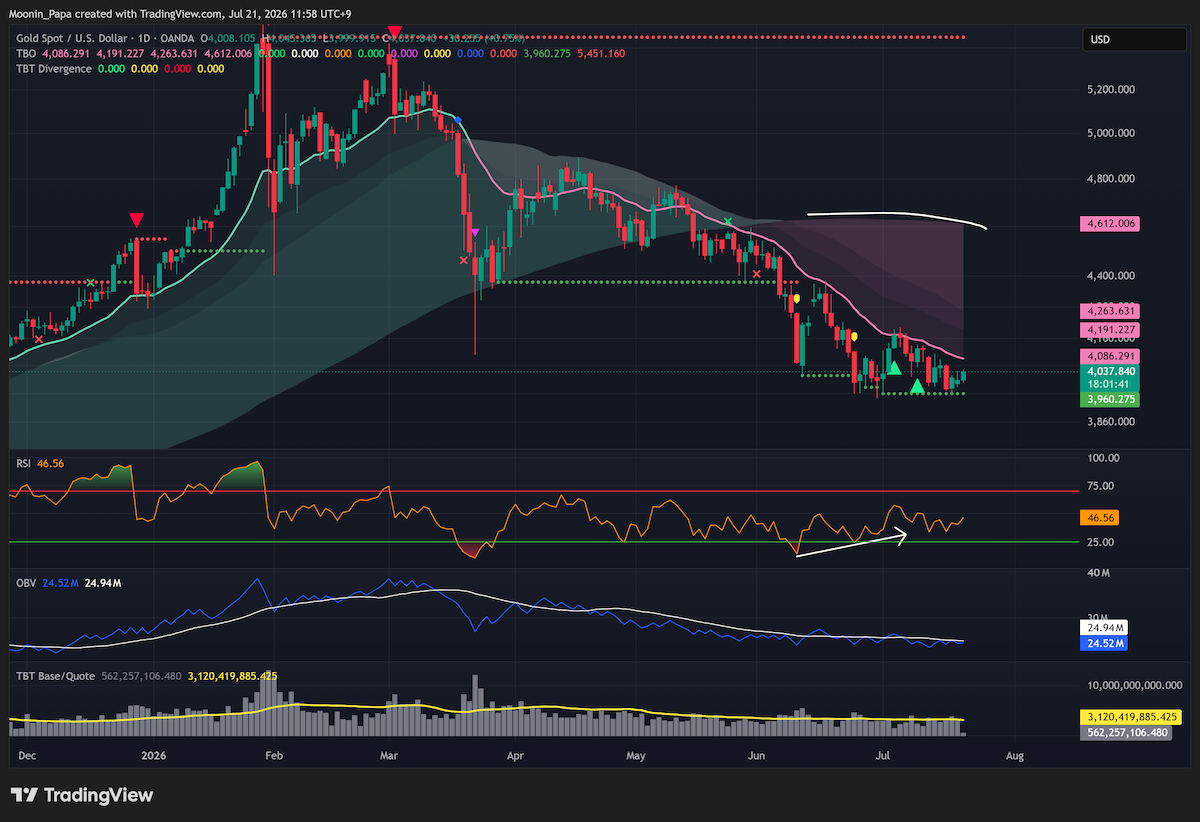
Gold daily chart below the TBO Cloud
Gold remains strong bearish below its daily TBO Cloud, and its Slow line has begun to curl downward, indicating that the macro trend is turning bearish. Silver and platinum carry the same counter-trend warning, while copper remains weak bullish.
WTI closed its mid-June gap on Monday as RSI reached 74.94. A red close would form a bearish RSI Reset and could begin the next move toward the remaining open gap near 68. Uranium, by contrast, moved into oversold daily RSI and offers a tactical bounce setup.
ALT dispersion rewards chart-by-chart execution
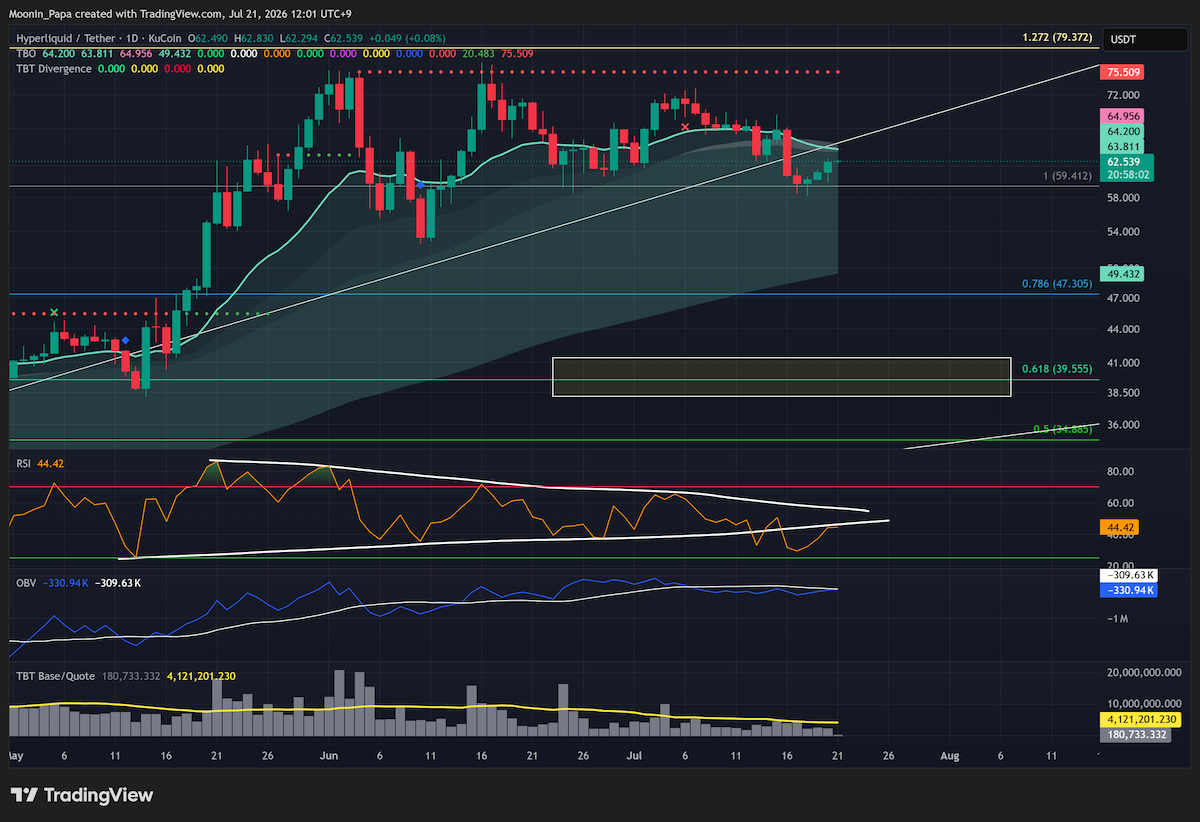
HYPE chart testing recently lost support
HYPE is approaching recently lost support that should now act as resistance. LINK confirmed a TBO Open Long, while ONDO also confirmed an Open Long but faces TBO Resistance at 0.4098. PUMP is more mature, with RSI around 83 and price approaching TBO Resistance at 0.002202, which the source calls a likely termination zone.
The reversal board is mixed. STX printed a second bullish-divergence cluster, MYX printed its first bullish divergence since April 13, and VVV is working on a second divergence. LDO is moving toward bearish divergence, and NIGHT fell more than 40% on Monday.
Learn my strategies and the tools I use every day by visiting The Complete Cryptocurrency Investor by Mastering Assets.
