


Gold stalled for the first time since its breakout out of the $4,000 - $4,200 range Tuesday as it made a two-month high and then reversed giving back earlier gains. August futures ended the day with a loss of $20.80 or 0.47% at $4,427. Other than yesterday, today’s closing price is still the highest since June 5th. The movers of gold in Tuesday’s session were based upon fundamental and technical forces, a shift from a market that recently has been driven purely of fundamentals.
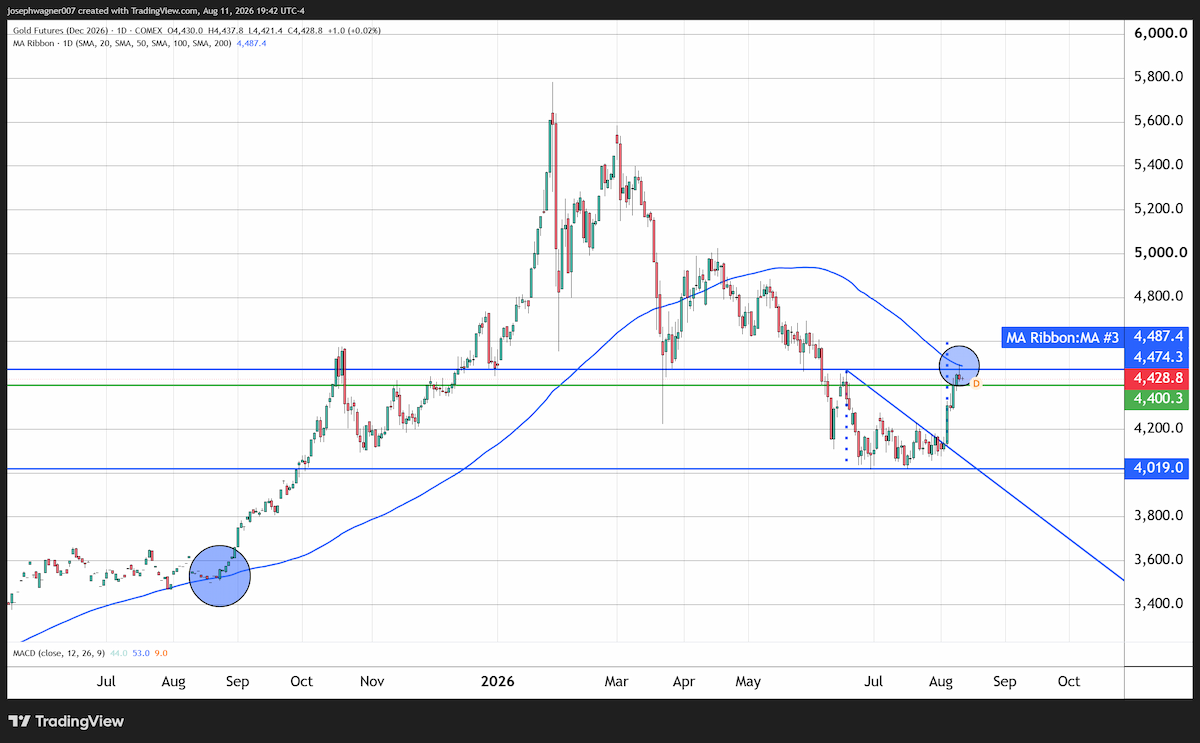
The play that took gold above its narrow range and its descending triangle is the same driver that has been suppressing gold’s value for months. Which is perceived future actions of the Federal Reserve. The rally ignited on Wednesday August 5th based upon slowing job growth as shown on the ADP private payroll report for the month of July released that day. A weak labor market is the only thing that would cause the Fed not to tighten amidst a period of high/rising inflation other than a catastrophe. The 44,000 jobs added in July (around half of the 70,000 estimated by analysts) along with a weak dollar allowed gold to rally by $176 a feat not seen since February.
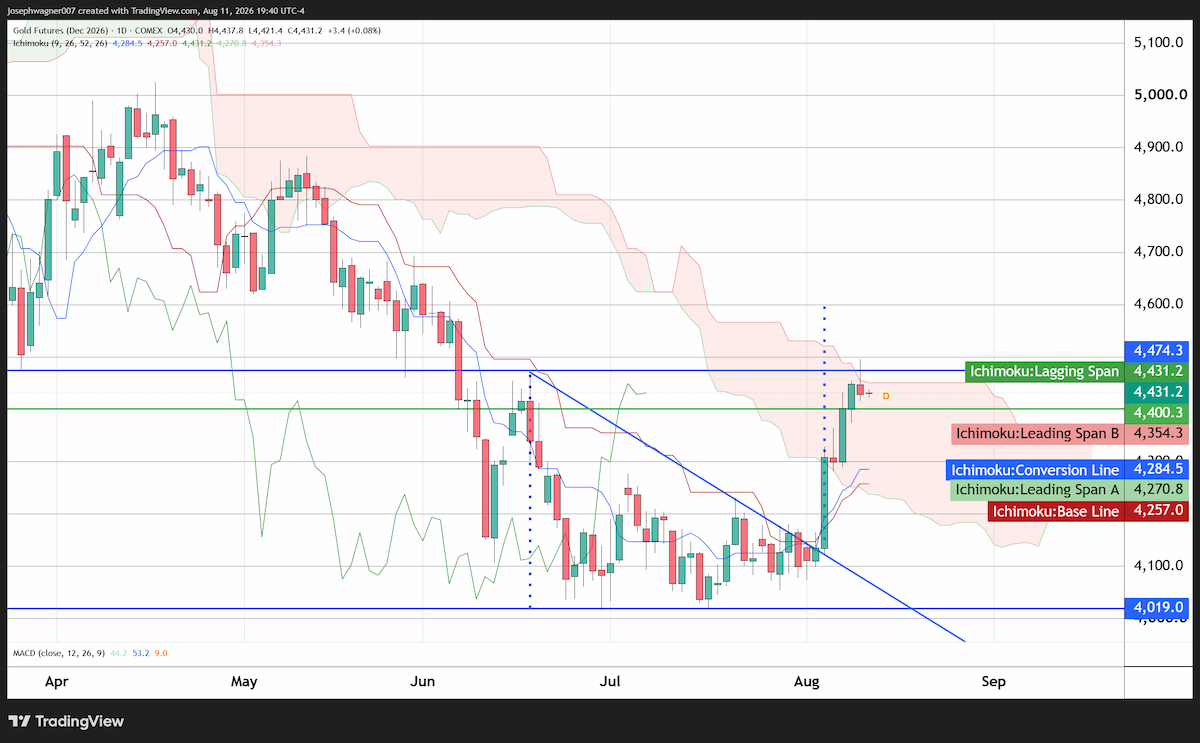
On the surface the move appeared to be sparked by shifting Fed sentiment due to a weaker labor market. Under the surface the intensity of the price spike, culminating in the largest single-day increase since February was technically based. Gold has been building energy since coming off of its all-time record this January like a spring it has been compressed further and further storing more and more energy. This kinetic force more often than not is released all at once or in a very short period. That’s exactly what occurred last Wednesday as gold broke free from its descending triangle pattern. Another way to look at it is traders who had been wanting to buy gold for months finally had justification to do so that led to liquidation of short positions that had been banking on the idea that the $4,200 ceiling would hold which added bullish momentum.
This was a very welcome outcome for gold bulls as a descending triangle tends to break in the prevalent trend direction so the upside break was significant. It could very well prove to be the turning point for gold as it continued higher as it went on to gain $314 or 7.62% in only four trading days.
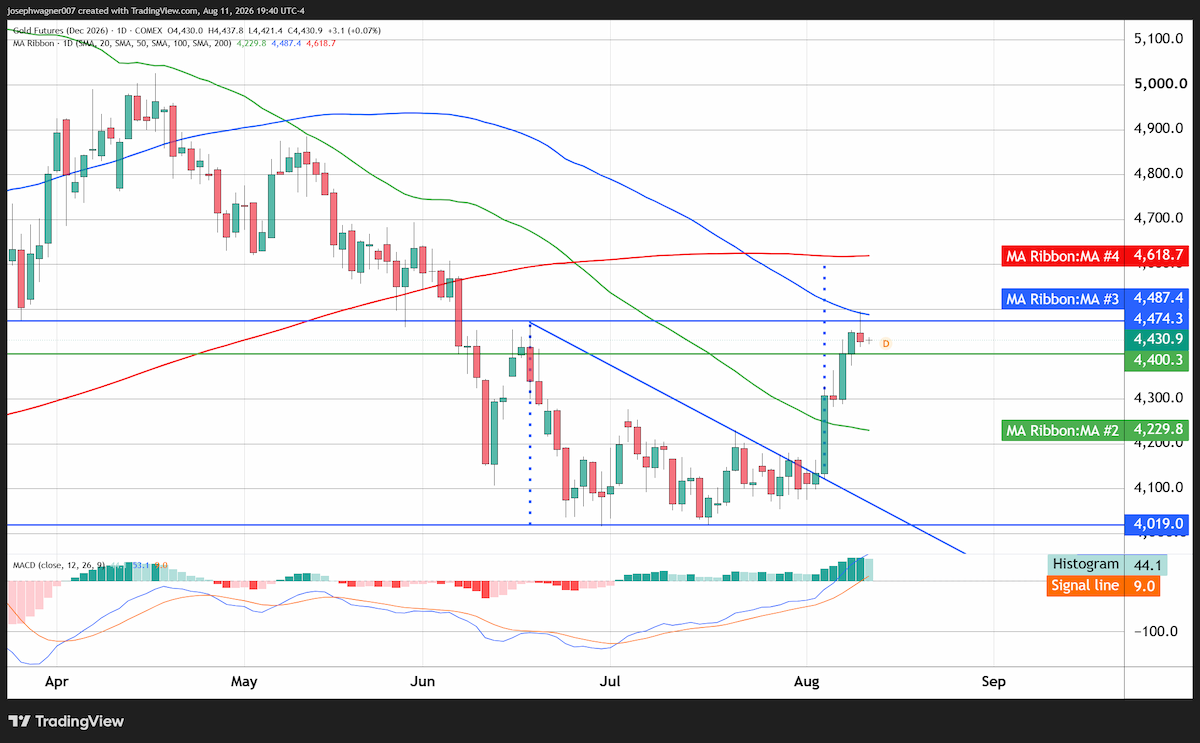
Just as last week, Tuesday’s headlines are citing tomorrow’s release of the July CPI report as crucial for gold to continue its move to higher prices. The numbers could push gold higher, pull it lower, or have minimal affect if it doesn’t move the rate hike odds in a meaningful way. Traders should really pay attention to the technical aspects of the market in order to profit. Gold is once again just beneath a key level of resistance and as such any upside breakout has the potential to be a substantial one. Current resistance is formed by two converging technical indicators one Eastern, One Western. Tuesday’s two-month high touched upon both the upper edge of the kumo or cloud when an Ichimoku study is added to a daily chart. The intraday high also coincides with gold’s 100-day simple moving average, an indicator that gold has not been support since August 2025, when gold was trading around $3,500. Gold currently has support at $4,400 a break below that level would open the door to re-testing the $4,200 support level.
All things being equal, gold’s path of least resistance is to the upside, gold bulls have not had the upper hand for quite some time. The 5 consecutive higher highs and higher lows along with a bullish MACD put gold in a good position to reach $4,600 in the near-term if the CPI comes in cool or even neutral.
Whishing you as always, good trading.
I invite you to our full-service analysis at thegoldforecast.com.
