

My August 25 read keeps two timeframes separate: I expect a Bitcoin pullback, but I still see weekly and macro strength. That distinction also shapes my Ethereum, stablecoin-dominance and ALT views.
Bitcoin’s daily pullback still needs reversal confirmation
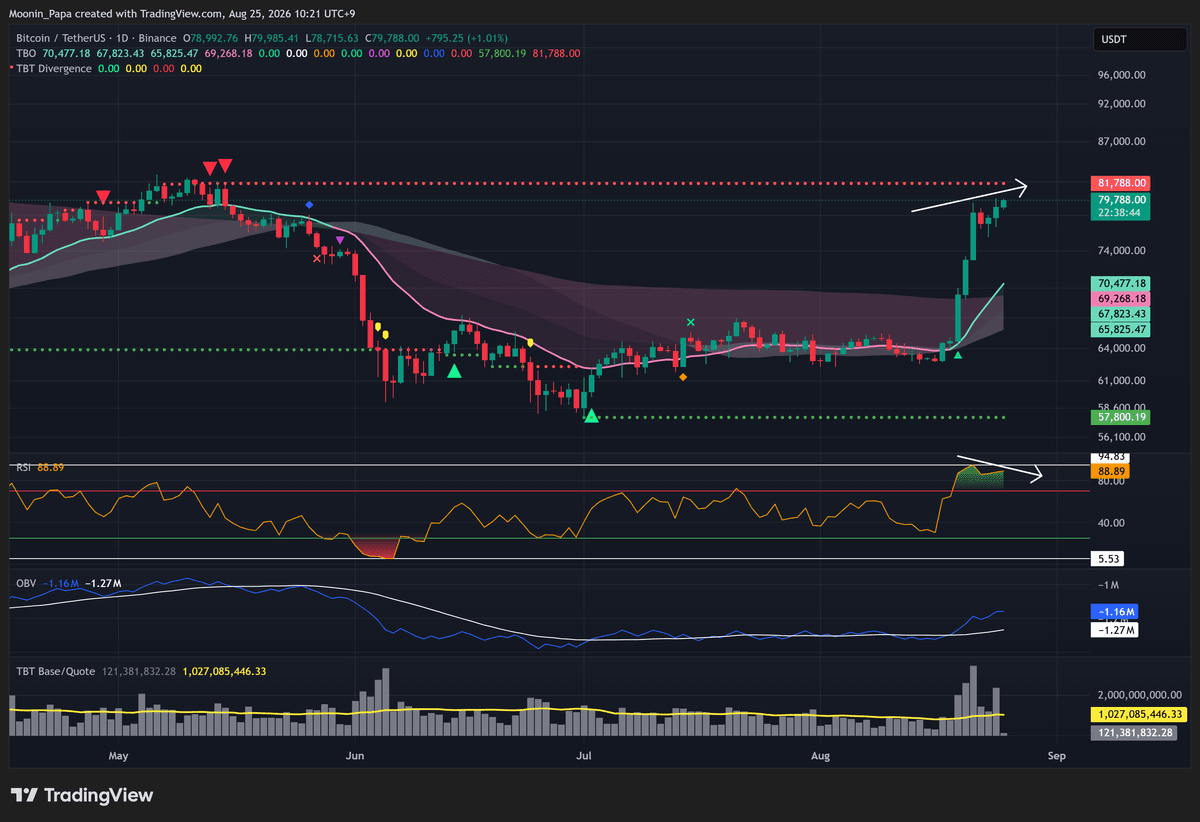
Bitcoin daily chart
I see confirmed higher highs in BTC against lower highs on RSI, giving me the makings of daily bearish divergence. A pullback to tag or touch the daily TBO Fast line is coming, but the question is when, not if. Eager bears can get hurt by shorting too early, so I want the first reversal move for confirmation before trying to short. OBV remains very bullish; while its white MA line keeps moving upward, I prefer buying dips and avoiding shorts on pumps.
The BTC bear flag is only a 30% extreme scenario
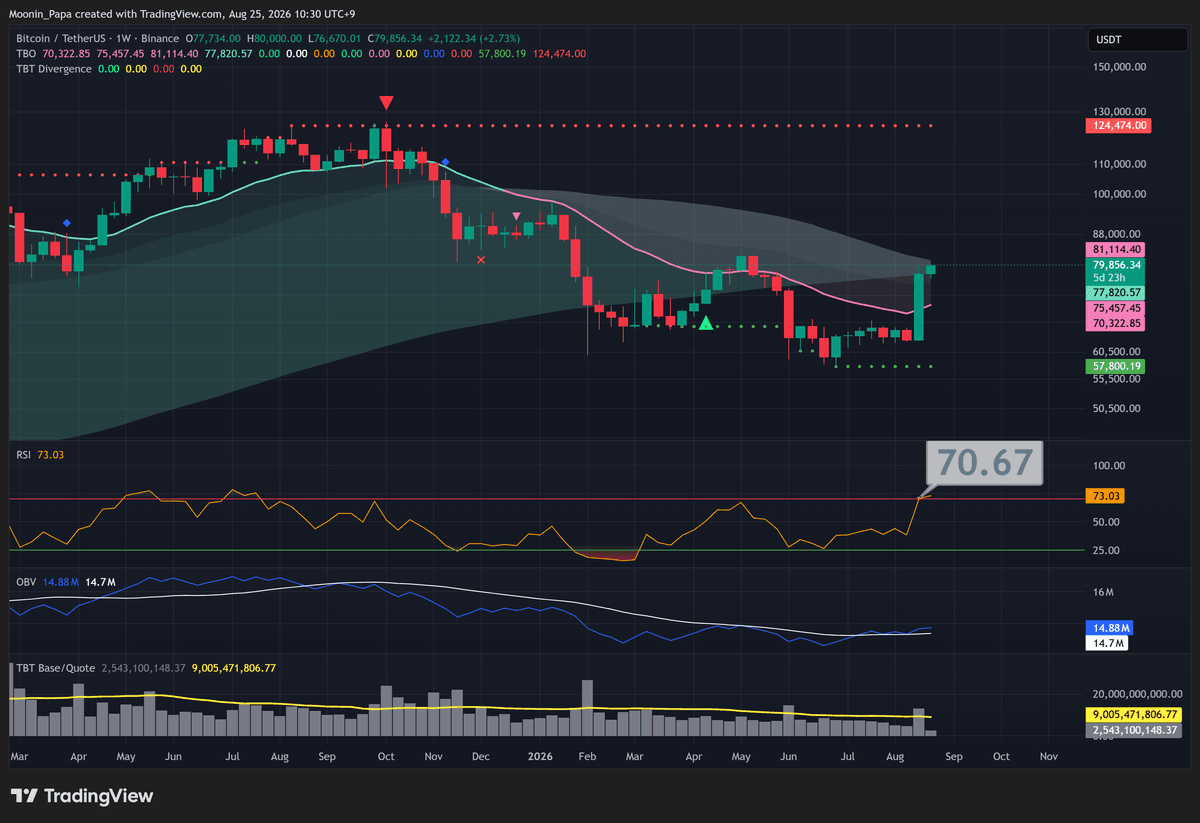
Bitcoin weekly chart
I do not expect a massive bearish reversal to begin immediately even if BTC tests and rejects historical support. The bear-flag argument is extremely wild; its measured $50k projection is an extreme conditional scenario and I give the flag only about a 30% chance of being valid. A close inside the parallel channel invalidates the flag. Against it, weekly BTC is already well inside the Cloud in bullish consolidation. Weekly RSI is confirmed overbought, which means strong bullish continuation, OBV is bullish and macro charts lean very bullish. Buying the dip makes much more sense from here.
ETH’s weekly Close Short points to about $2,000
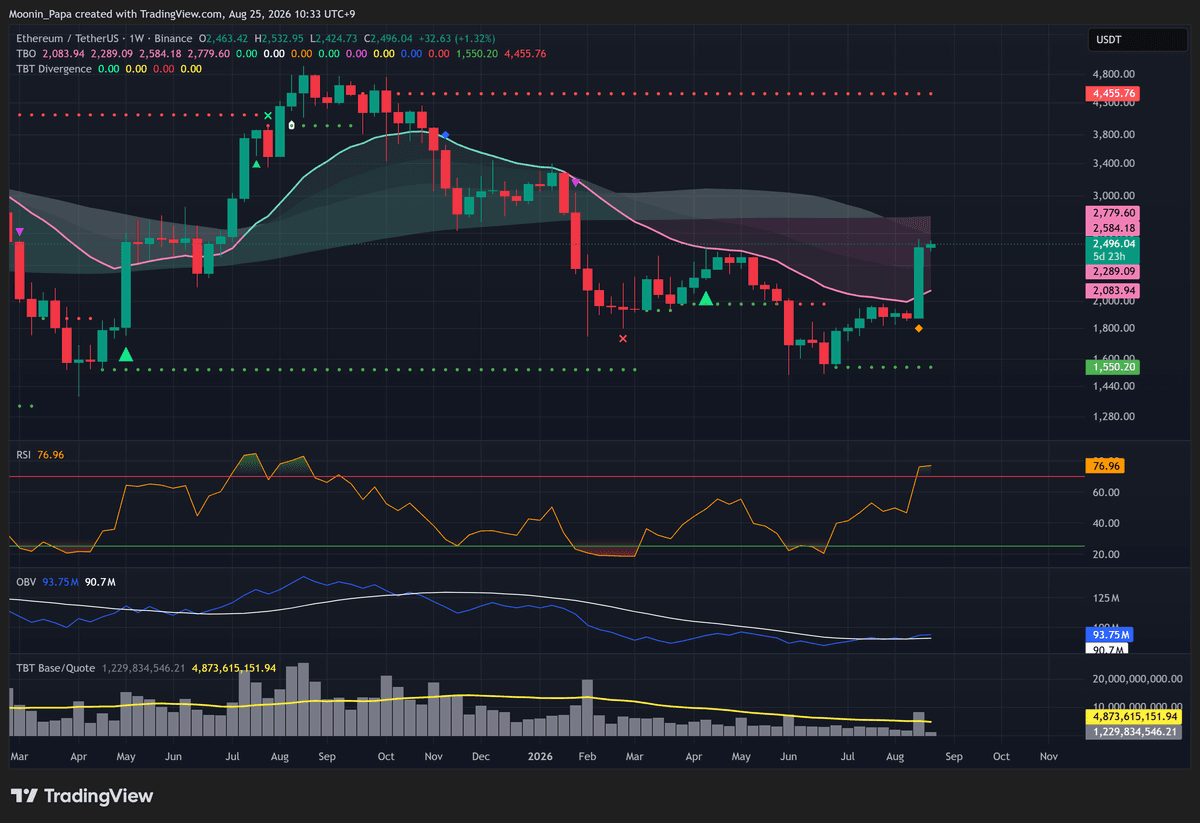
Ethereum weekly chart
I still see ETH as strong bullish on its daily indicators and weekly chart. Its weekly Close Short means I expect a pullback to the weekly Fast line around $2,000, which I would treat as a buy-the-dip moment. A drop below $1,500 is not my standalone ETH thesis; it is conditional on BTC confirming its bear flag through rejection at historical support. I put that BTC flag’s validity at about 30%.

Stablecoin dominance closed below TBO Support
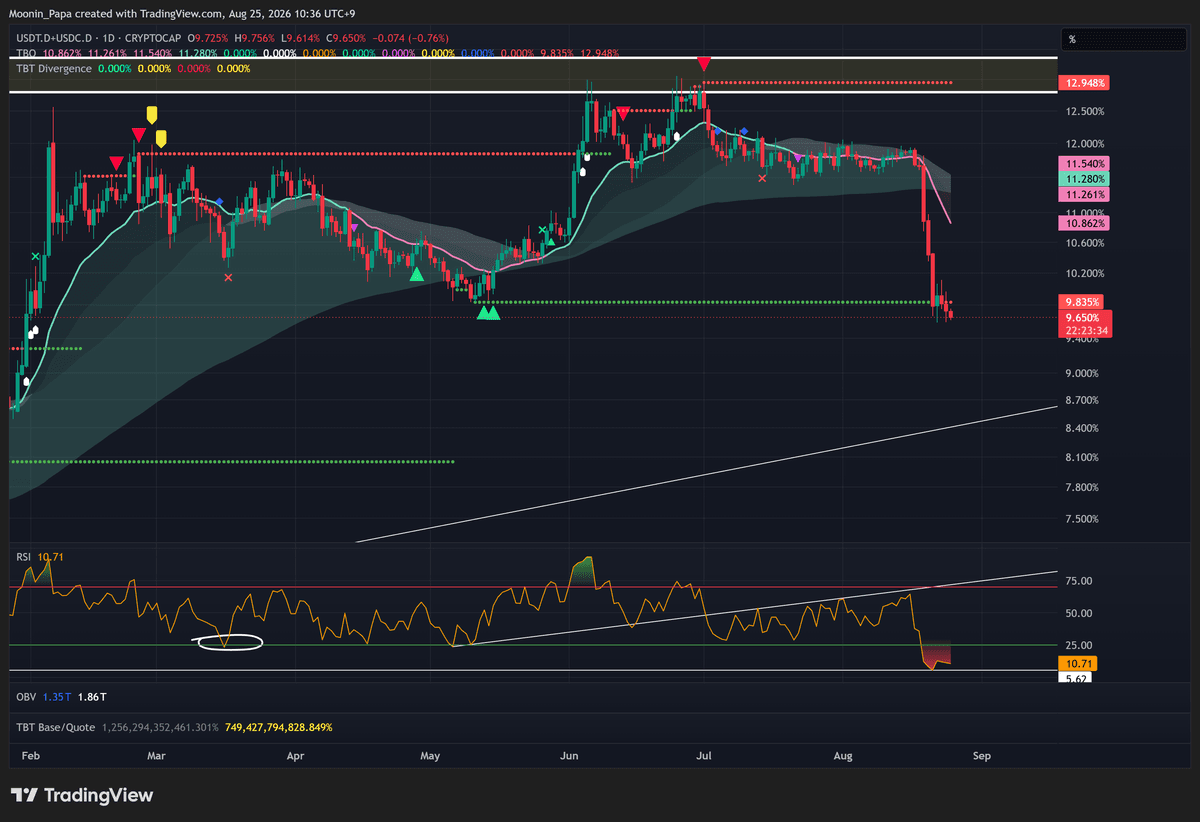
Combined stablecoin dominance chart
I saw combined stablecoin dominance close below TBO Support on Monday. That confirms a strong bearish trend, which means crypto should continue staying strong bullish. STABLE.C.D also lost its first support fan line. Dominance is market share, not spot price, so I do not flatten this into a direct spot-price target or a guaranteed price path.
ALTs remain early, but a major pullback is still possible
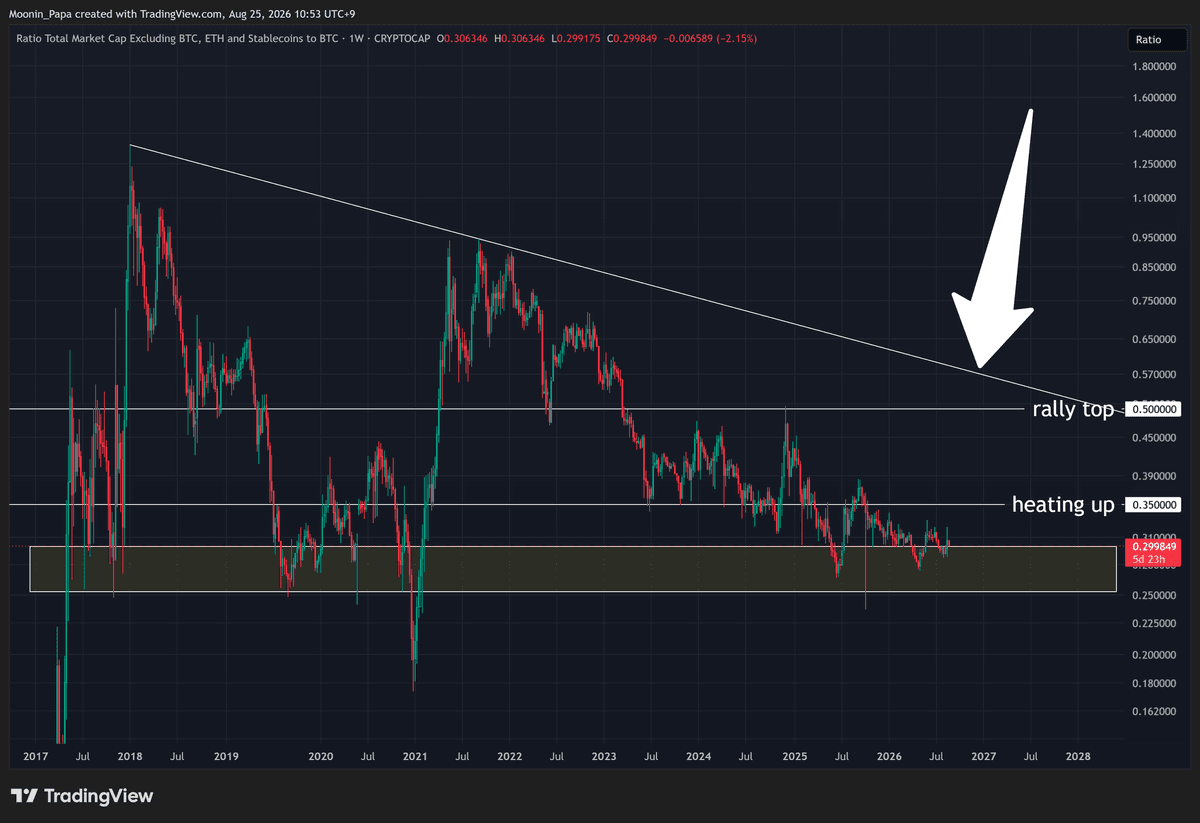
TOTAL3ESBTC weekly chart
I think this is the time to start building positions and using DCA Bots to accumulate for a future payoff, even though a massive or major pullback can still happen. On TOTAL3ESBTC, I treat 0.35 as frothy and possibly near a short-term top. At 0.5, I would consider that most certainly a rally top; anything above 0.50 would be an insane rally and a life-changing market moment. These are chart-ratio levels, not ALT spot-price targets.
TradFi pullbacks remain dip-buy opportunities
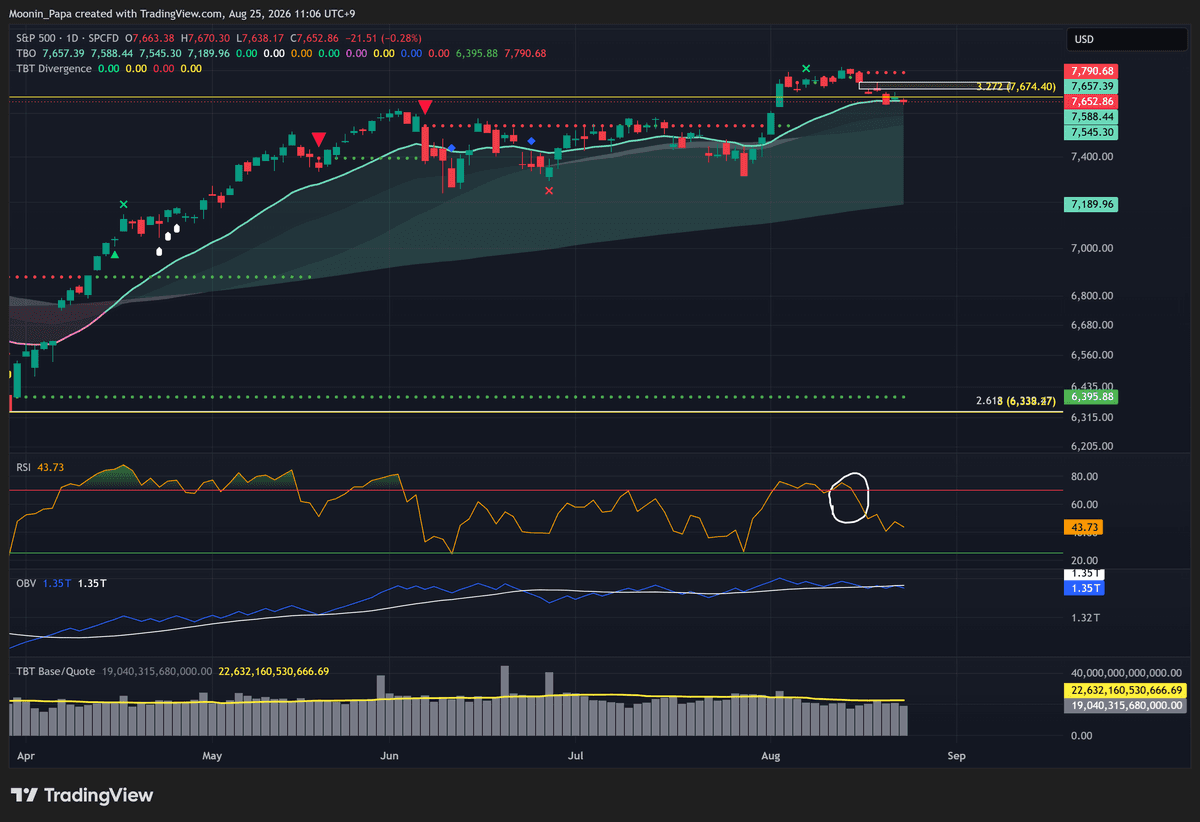
S&P 500 spot daily chart
I see S&P Futures and the SPX spot chart in bearish consolidation inside the Cloud, but I am not worried about TradFi. From here I treat pullbacks as dip-buy opportunities. DJI moved back above the Cloud, NDX is working toward its lower gap, and a move below the Cloud in NVDA would be a major buy-the-dip opportunity. I keep those states distinct rather than calling every index strong bullish.
Learn my strategies and the tools I use every day by visiting The Complete Cryptocurrency Investor by Mastering Assets.
