

My August 27 read keeps the tension intact: BTC is overbought at resistance, SOL dominance has a powerful but possibly exhausting breakout, broad ALT market cap is bullish, DXY remains bearish, Gold stays strong and faster ALT charts are flashing early pullback warnings.
Bitcoin is overbought at resistance
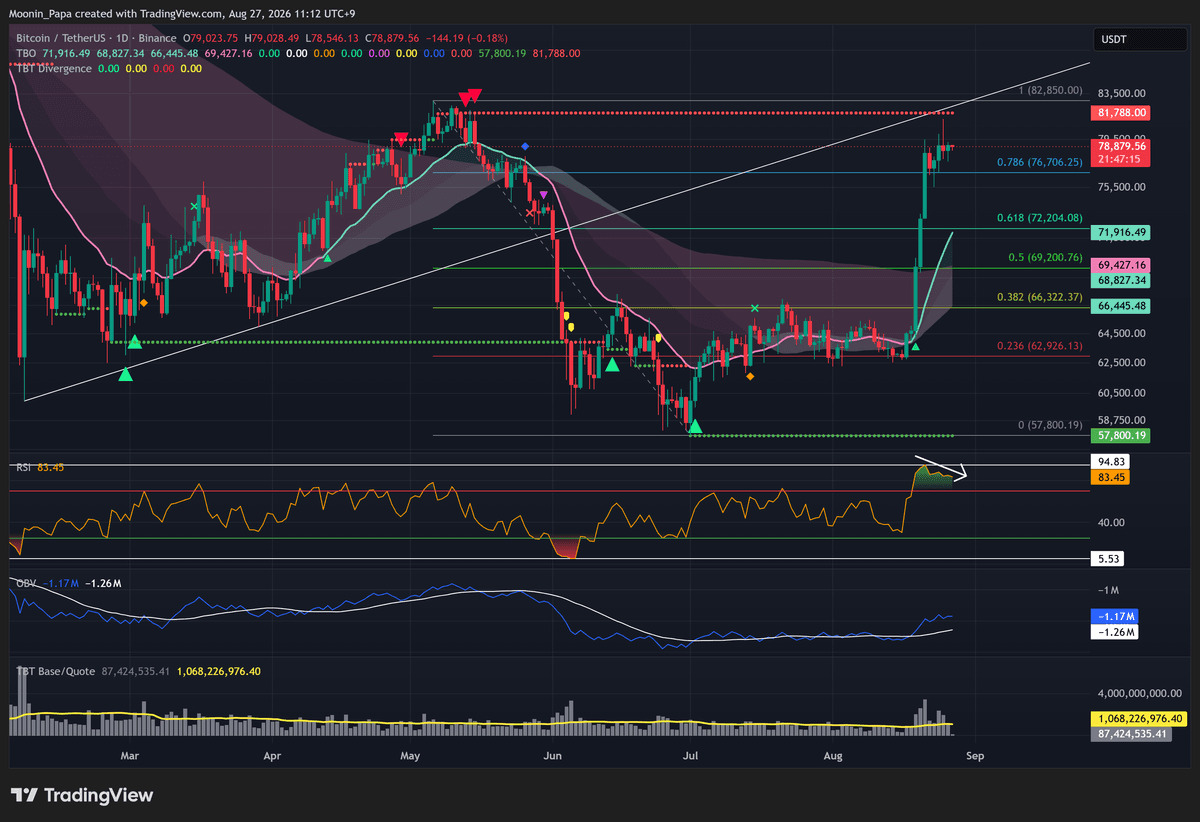
Bitcoin daily chart
I see BTC waiting at TBO and historical support-now-resistance while RSI makes lower highs, the overbought streak reaches eight days and volume dries up. My expected outcome is a pullback. The first target is the 0.786 Fib at $76,706. A close below that level is the trigger that would add momentum and make a move inside the daily TBO Cloud likely; it is not a prerequisite for the pullback thesis itself. After that, I expect a short-term bounce before the market reveals whether the next move is another bounce or a deeper pullback.
SOL dominance broke out at resistance
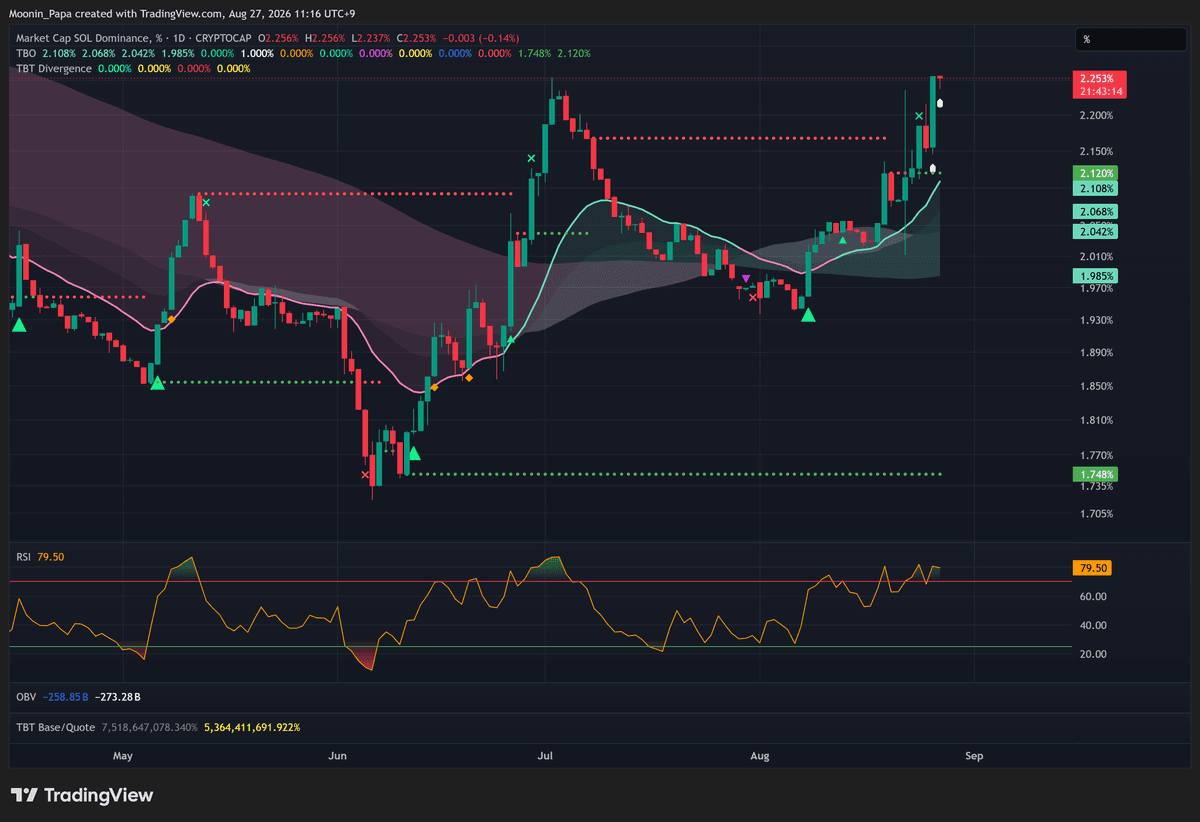
SOL dominance daily chart
I see SOL.D up 4.70% with a TBO Breakout printed right at resistance. It honestly looks more like an exhaustion breakout than a continuation breakout. Even so, all four lines of the TBO are curling up together, which makes higher highs plausible and would mean more money flowing into SOL. I preserve both sides rather than converting the exhaustion read into certainty. Dominance is market share, not spot price.
TOTALE is strong bullish but paused at the 0.382 Fib
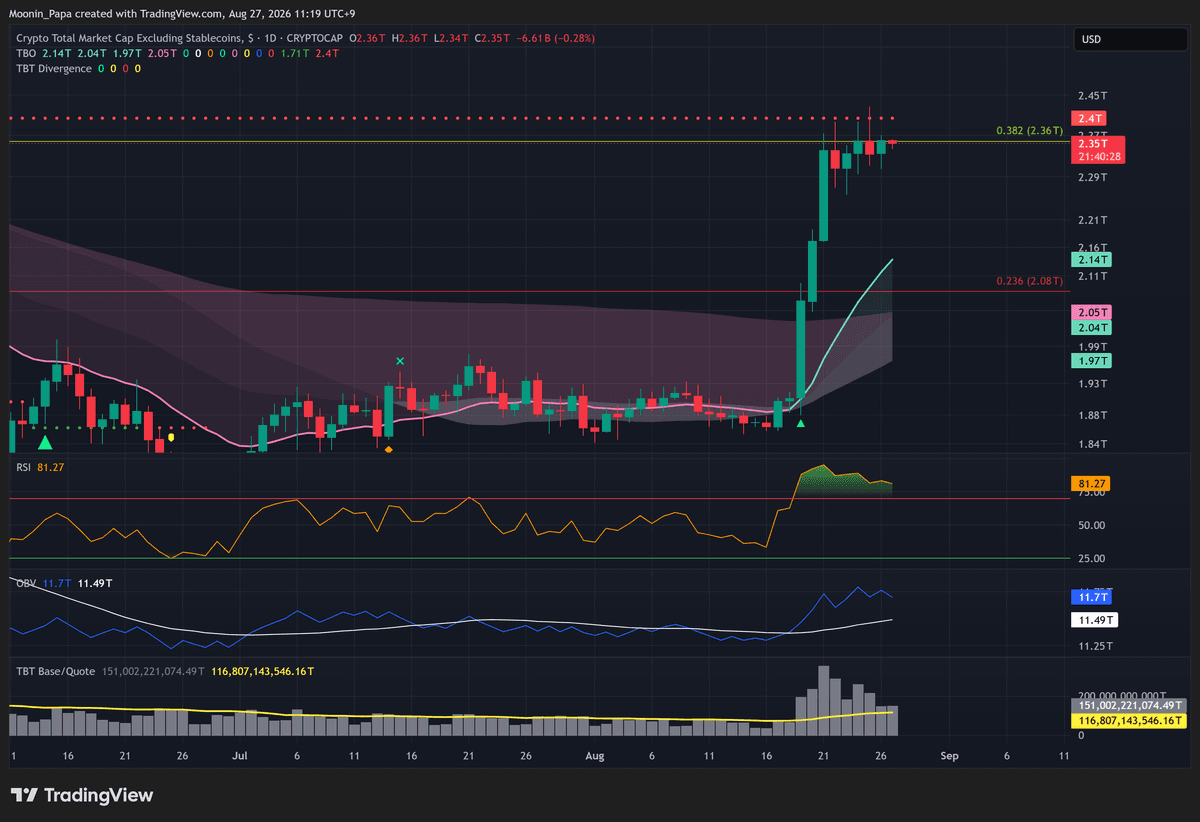
TOTALE daily market-cap chart
I see TOTALE stopping at the 0.382 Fib, making it short-term resistance. Volume is decreasing and RSI is weakening slightly, but the chart remains very strong bullish and supports my bullish ALT thesis. The breadth states are not uniform: TOTALE50 is strong bullish above the Cloud but at risk of a bearish RSI Reset, TOTALE100 remains inside its Cloud, OTHERS market cap is very strong bullish and OTHERS/BTC printed another TBT Bullish Divergence. OTHERS.D is a separate dominance chart and remains strong bearish.

DXY remains in a strong bearish trend
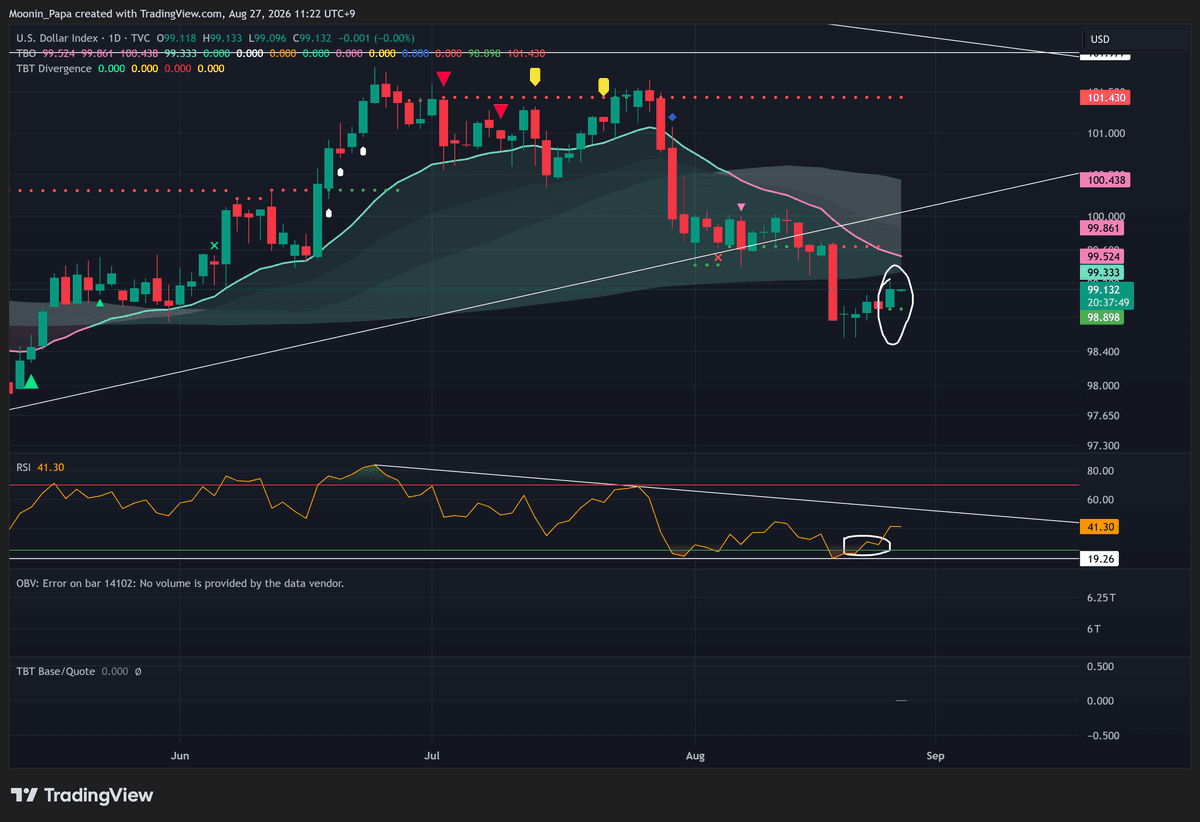
U.S. Dollar Index daily chart
I see DXY close up on Wednesday, causing TBO Support to drop again and identifying Wednesday's low as a strong pivot low. Because DXY already lost TBO Support last Wednesday, my thesis is that the trend remains strong bearish and DXY is likely to drop below the new low. That drop is still an expectation, not a confirmed event. The temporary DXY rise also explains the stress seen in forex pairs, including the Euro's further drop and confirmed bearish RSI Reset.
Gold stays strong bullish after its pullback
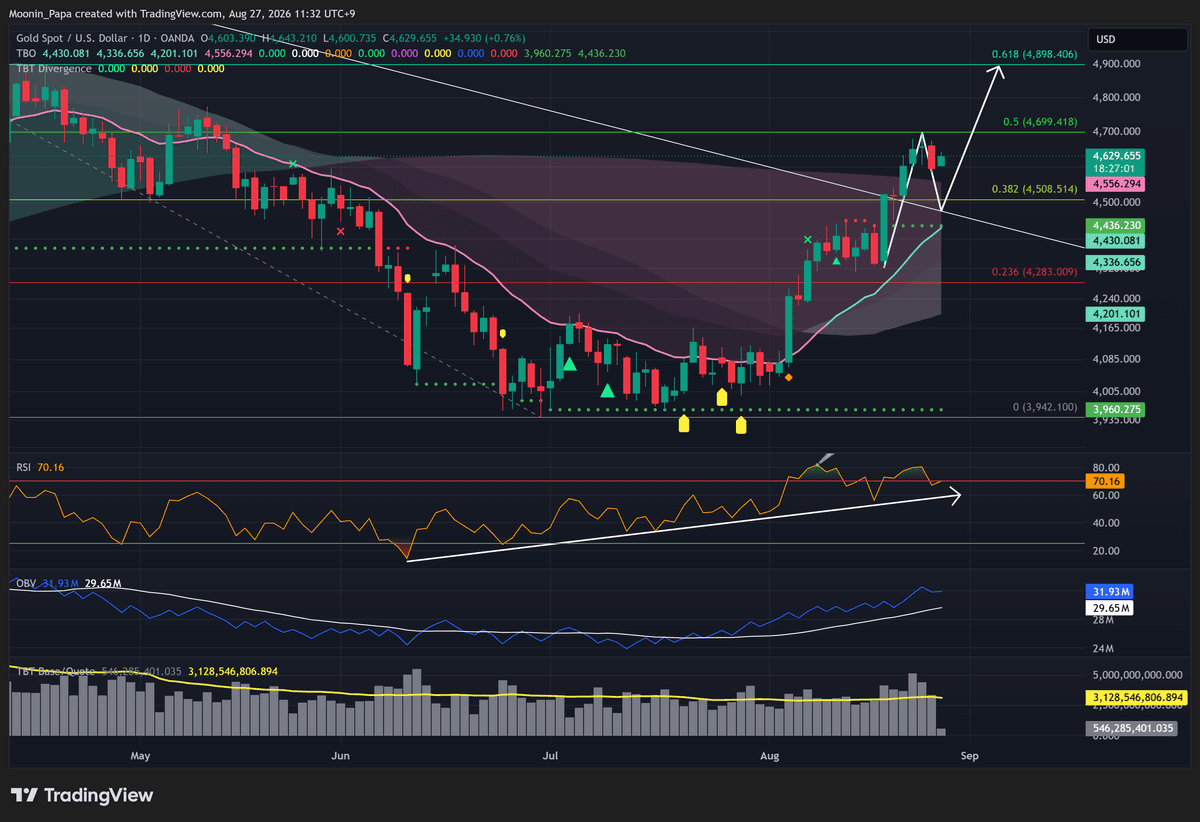
Gold daily chart
I see Gold remain strong bullish according to the TBO Cloud and bullish on OBV despite Wednesday's decent pullback. A second overbought RSI streak ended with a second bearish RSI Reset, so the strong state does not erase pullback risk. If Gold pulls back, I plan to look to add at newly broken resistance, which should be confirmed as support. Silver, Platinum, Copper and Uranium each have distinct triggers and warnings rather than one blanket metals call.
XRP joins a broad set of early ALT pullback warnings
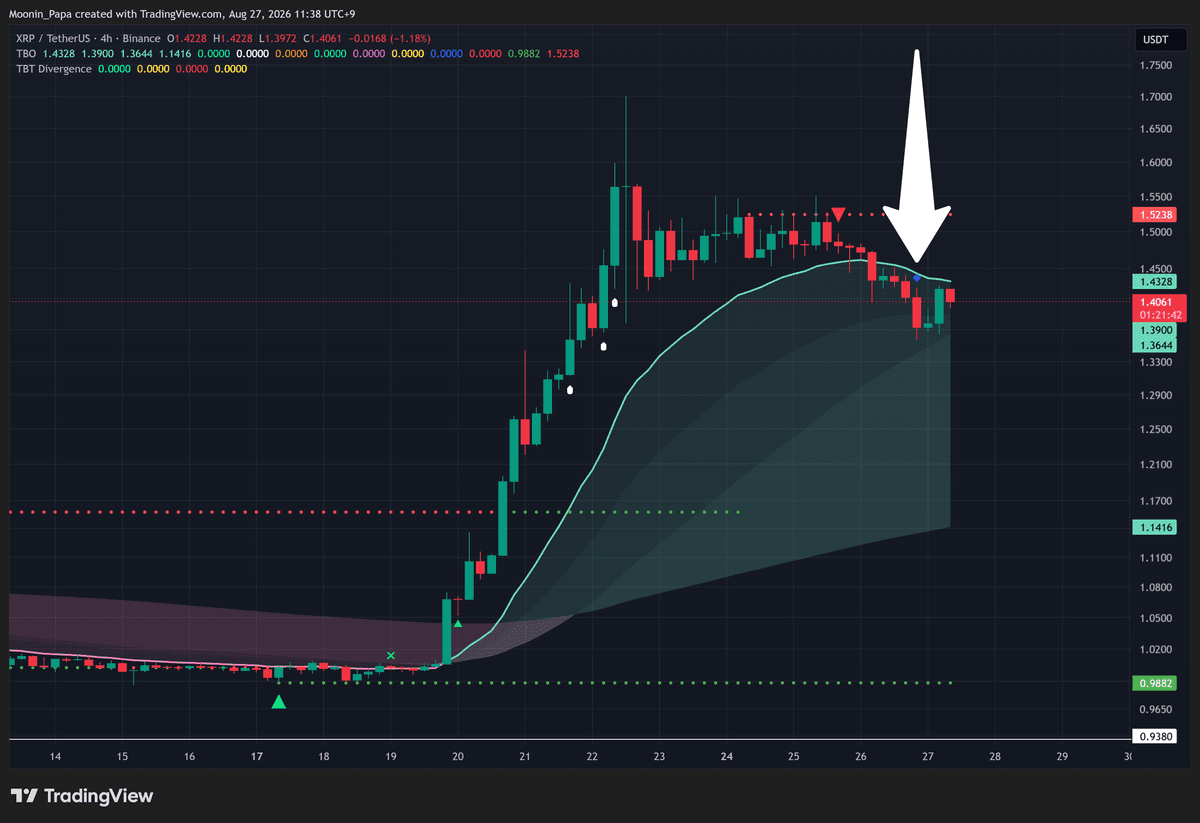
XRP four-hour chart
I see XRP print a TBO Close Long on the 4h. This faster-timeframe bearish reversal warning also appeared on many charts in the prior 24 hours, making it an early pullback warning rather than proof of a daily bearish reversal. SOL remains very overbought with a lower RSI high and drying volume; DOGE printed two 4h TBO Close Longs, ADA was building a second and XLM printed one. My broader conclusion is still to buy the dip on ALTs and expect a bounce, not to chase strength. I frame futures hedging only as protection against being wrong, with break-even at best.
Learn my strategies and the tools I use every day by visiting The Complete Cryptocurrency Investor by Mastering Assets.
