

My August 28 read keeps strength and exhaustion in the same frame: BTC and ETH are overbought near meaningful resistance, stablecoin dominance confirms a bullish crypto backdrop, DXY remains bearish, Gold has a conditional support test and SOL's surge carries an exhaustion warning.
Bitcoin slows into three resistance zones
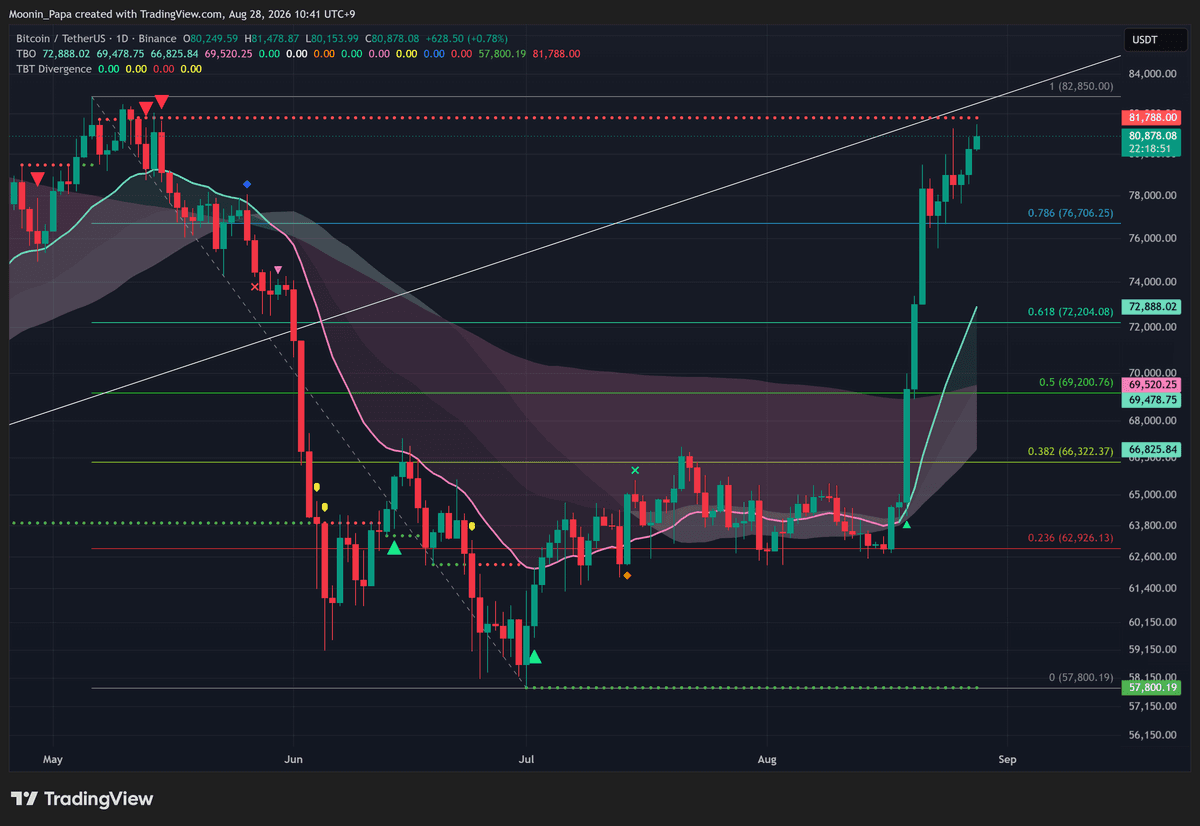
Bitcoin daily chart
I see BTC's new local high at $81,478 slowing as it approaches TBO Resistance at $81,788, long-term support that remains resistance until tested near $82,500 and May's wick cluster. Daily RSI is on a confirmed nine-day overbought streak, with lower RSI highs against higher chart highs. OBV and Volume are still bullish; Volume has decreased slightly but still outperforms its yellow MA. Jackson Hole is a possible source of change, not a confirmed catalyst, and I do not claim the U.S. government is pumping crypto.
Ethereum's strength carries an exhaustion warning
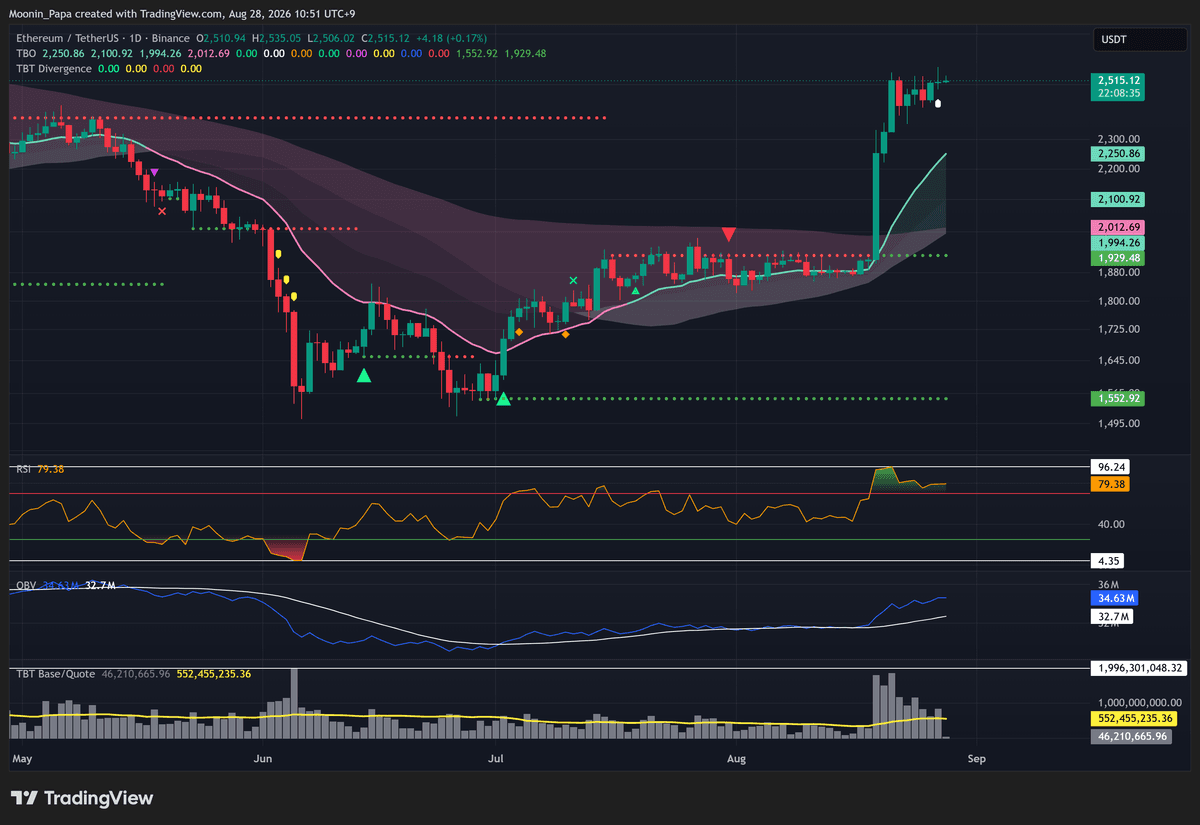
Ethereum daily chart
I see ETH confirm a Thursday TBO Breakout in a terrible location: very high and late. RSI is also on a nine-day overbought streak. Volume and OBV remain bullish and the weekly chart is strong bullish, but I still classify the Breakout as obvious exhaustion. In the current euphoria I struggle with shorting ETH, so exhaustion is a warning rather than an invented immediate short entry.
Stablecoin dominance confirms crypto's bullish backdrop
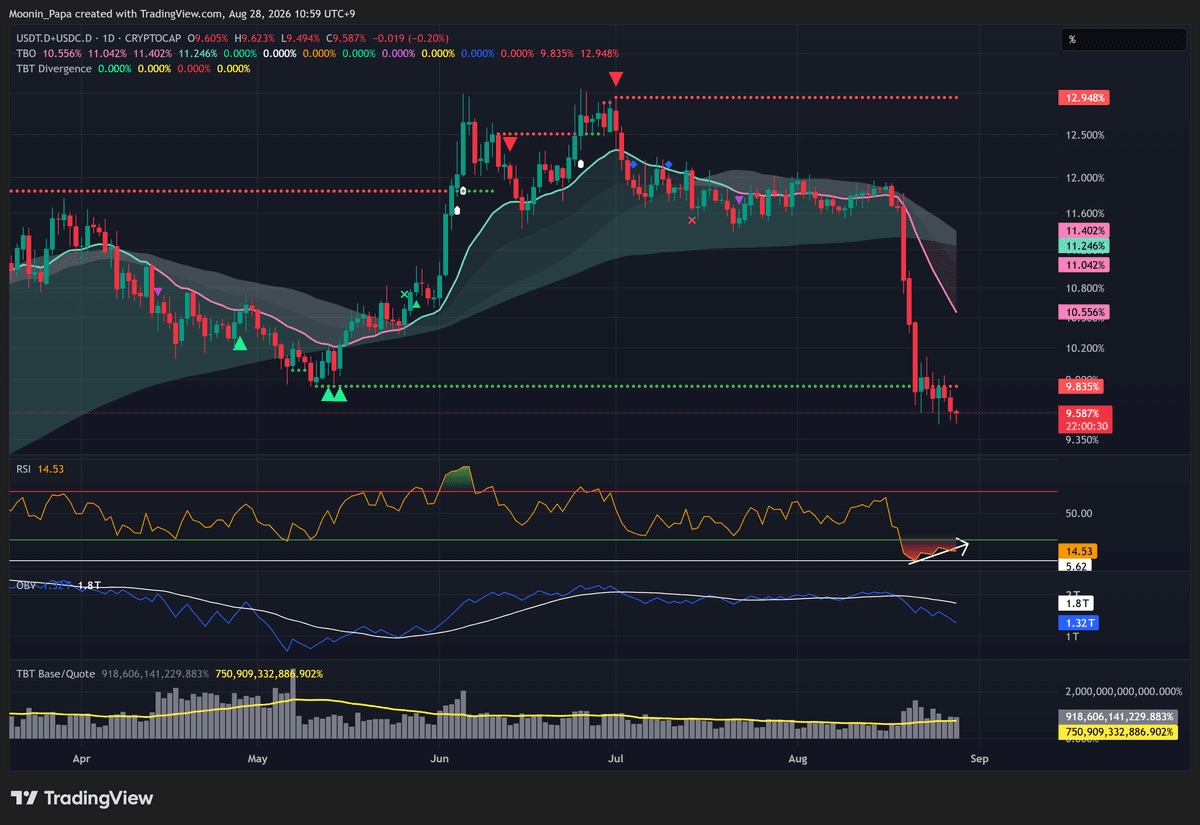
Combined stablecoin dominance daily chart
I see combined stablecoin dominance confirm a close below TBO Support. That is a strong bearish trend for the dominance chart and therefore a strong bullish uptrend signal for crypto. We are due for a pullback, but continuation higher looks more likely than a massive surprise pullback. STABLE.C.D also confirmed a Thursday TBO Breakdown and is building another; because these printed after the breakdown while the chart is deeply oversold, I read them as exhaustion breakdowns more likely to predict a bounce than another drop. Dominance is market share, not spot price.

DXY remains strong bearish below the Cloud
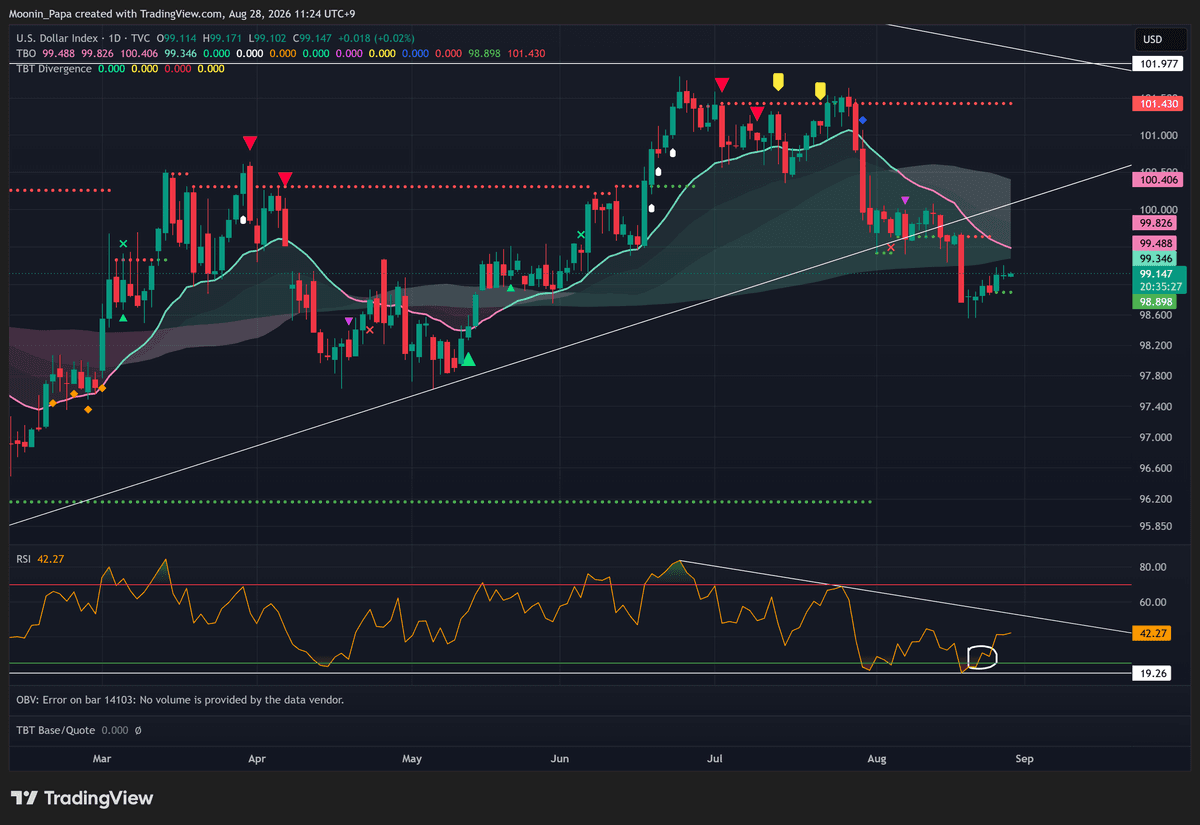
U.S. Dollar Index daily chart
I still see DXY strong bearish below its Cloud, and it has yet to tag the daily Fast line. I ultimately expect it to move much lower toward 96. I do not know whether Friday's Jackson Hole comments will start that move, so I preserve the target as my expectation and the event link as unconfirmed. If DXY drops, EURUSD should move up and USDJPY should follow down, but I do not call USDJPY safe until a close below 155.025.
Gold's pullback needs its own confirmation sequence
Gold daily chart
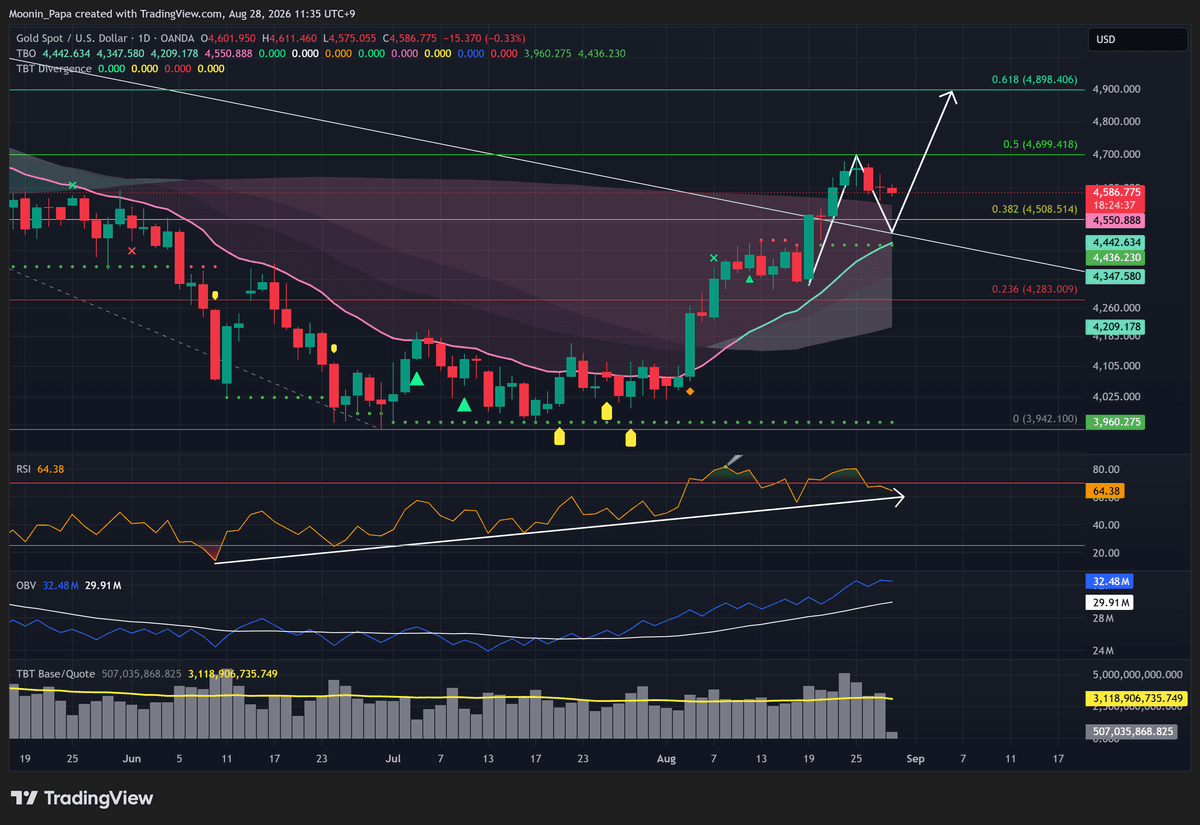
I think Gold will begin a pullback to newly broken resistance. That level should be confirmed as support once price bounces from it: the pullback is the expectation, while the bounce is the later support-confirmation object. Weekly RSI is only in progress of printing a bearish RSI Reset on an unfinished weekly candle. If it confirms, Silver and Platinum are expected to follow; Copper is separately expected to bounce.
SOL's surge looks like an exhaustion Breakout
Solana daily chart
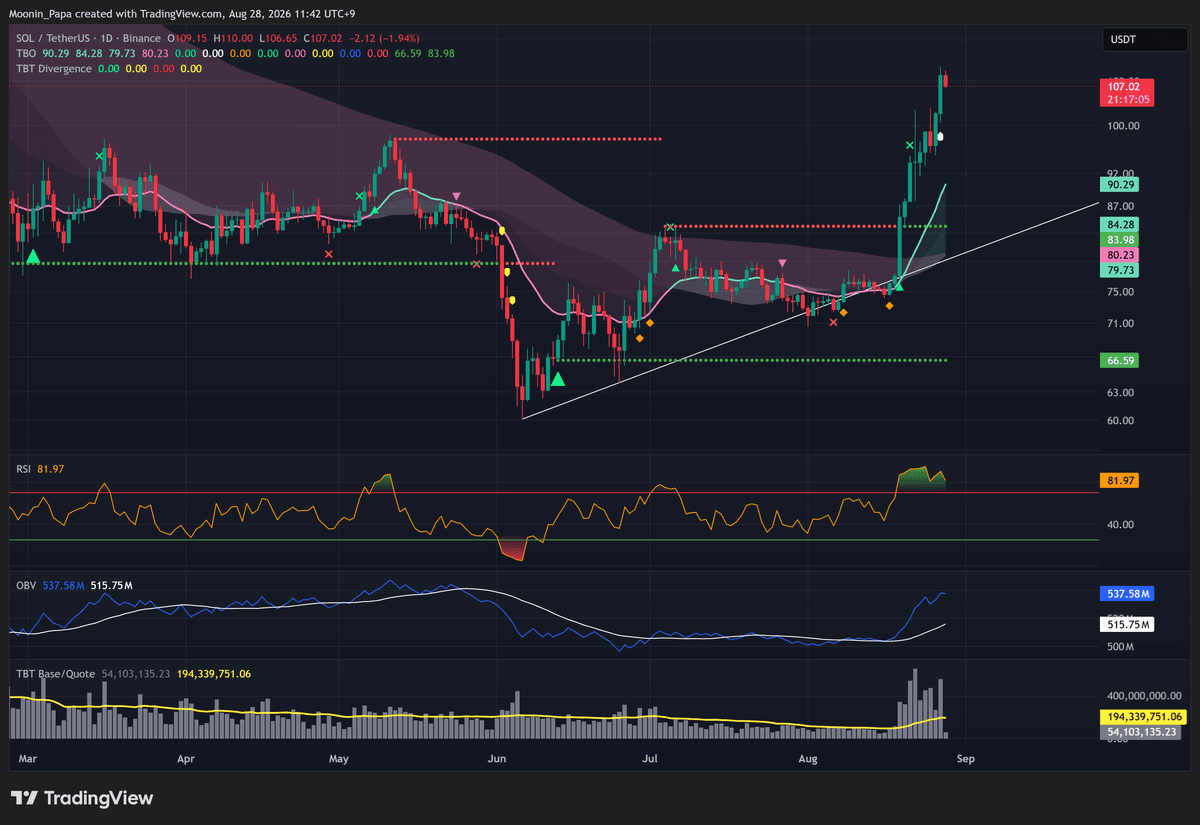
I see SOL pump nearly 7% on Thursday and print a TBO Breakout on the move. That looks like an exhaustion Breakout to me, not a guaranteed reversal or an immediate short entry. The broader source still frames this as a buy-the-dip market: OTHERS market cap is very strong bullish, even while OTHERS.D, TOTALE50.D and TOTALE100.D remain strong bearish dominance charts. I keep market-cap state and market-share state separate.
Learn my strategies and the tools I use every day by visiting The Complete Cryptocurrency Investor by Mastering Assets.
