
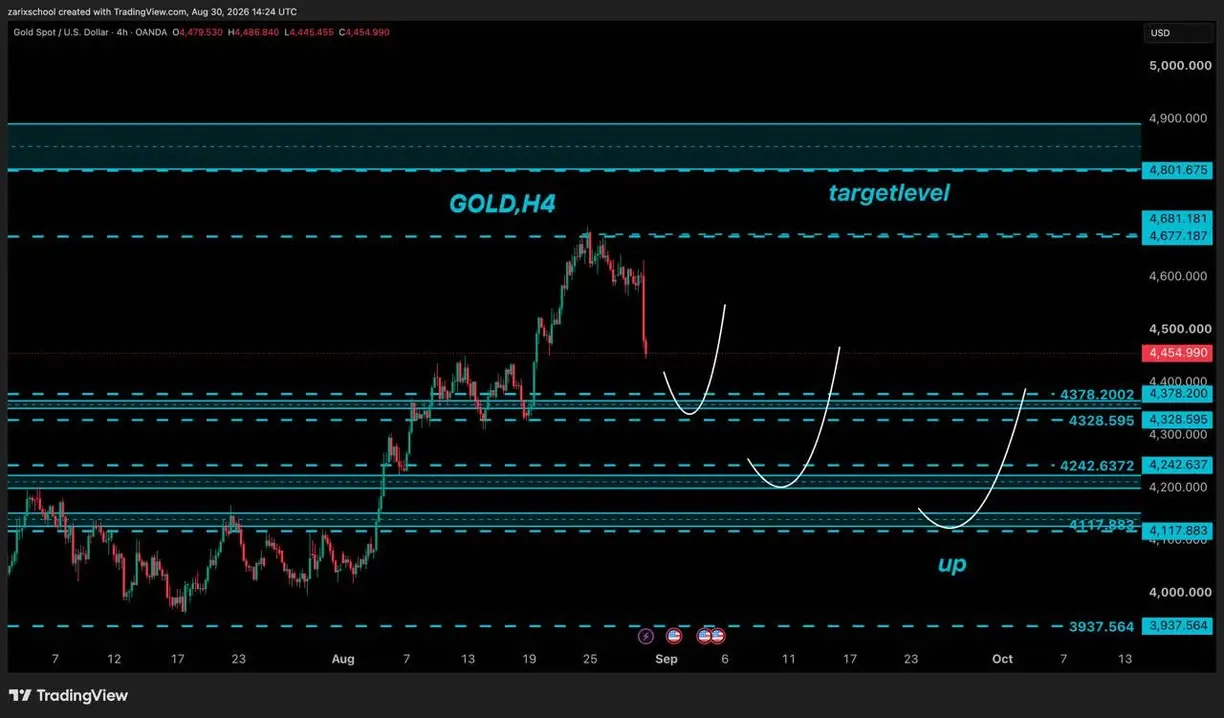
Gold is correcting on the four-hour chart after its recent advance stalled near the $4,677–$4,681 area.
The chart now highlights three potential support areas where the current decline could stabilize: $4,378–$4,329, $4,243 and $4,118. How price responds around these levels could determine whether gold can make another attempt toward the recent high and, eventually, the $4,802 target area.
Spot gold was trading near $4,455 at the time shown on the chart.
$4,378–$4,329 is the first support zone
The nearest support is concentrated between approximately $4,378 and $4,329.
This is the first area to watch for signs that the correction is losing momentum. A clear four-hour reaction from this zone could support a recovery toward the upper resistance area.
A test of support by itself would not confirm that the decline is complete. The stronger technical signal would be stabilization around the zone followed by improving short-term price structure.
If price moves through $4,329 without establishing support, attention would shift to the next level near $4,243.
A deeper correction could extend toward $4,243
The $4,243 area represents the second potential support in the current setup.
A decline to this level would deepen the pullback, but the recovery scenario shown on the chart would remain possible if buyers establish support and price begins to recover.
From there, the first major upside test would still be the $4,677–$4,681 resistance area.
Failure to hold around $4,243 would increase the importance of the next major support near $4,118.
$4,118 is the key lower support
Of the three correction scenarios shown on the four-hour chart, the deepest brings gold toward approximately $4,118.
This is a particularly important level because a recovery from this area could preserve the possibility of another medium-term advance, while a sustained move below it would materially weaken the current recovery setup.
Below $4,118, the next marked level on the chart is approximately $3,938.
That makes the reaction around $4,118 important if the correction extends significantly below the higher support zones.
$4,677–$4,681 remains the main upside test
For the bullish scenario to strengthen, gold would first need to recover from one of the identified support areas.
The next major test would then be approximately $4,677–$4,681, close to the recent four-hour high.
A rejection from this area could keep gold within a broader corrective structure. Conversely, a sustained break above it would strengthen the upside case and bring the higher target near $4,802 into focus.
The $4,802 level should therefore be viewed as a conditional target rather than an immediate objective.
What to watch next
The chart currently allows for three different depths of correction:
- $4,378–$4,329: the first and shallowest support zone.
- $4,243: the next support if the initial zone fails.
- $4,118: the key lower support in the deeper correction scenario.
The technical picture would improve if gold establishes support at one of these areas and subsequently regains the $4,677–$4,681 resistance zone.
A sustained break below $4,118 would weaken that outlook and shift attention toward approximately $3,938.
Until one of these conditions develops, the four-hour chart remains in a corrective phase with several possible recovery zones rather than a confirmed reversal.
Gold 4-Hour Technical Outlook: Key Support and Upside Levels
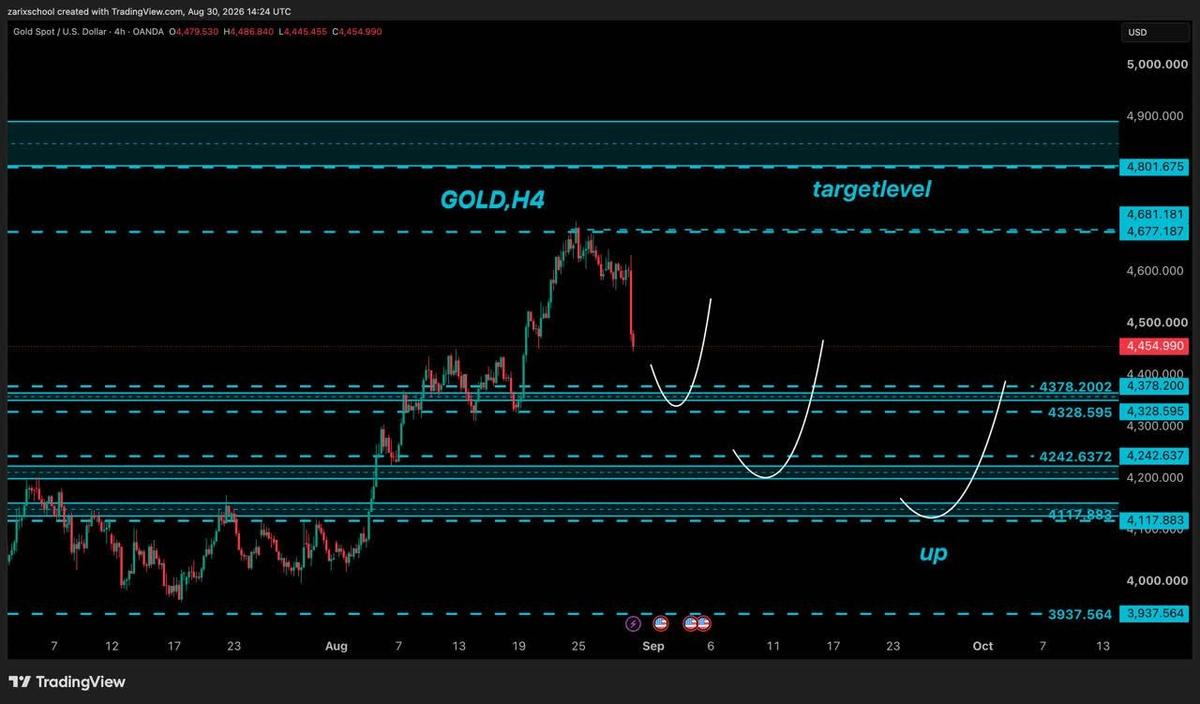
Gold four-hour chart showing three potential correction zones and the key resistance levels that could determine the next upside attempt.
