
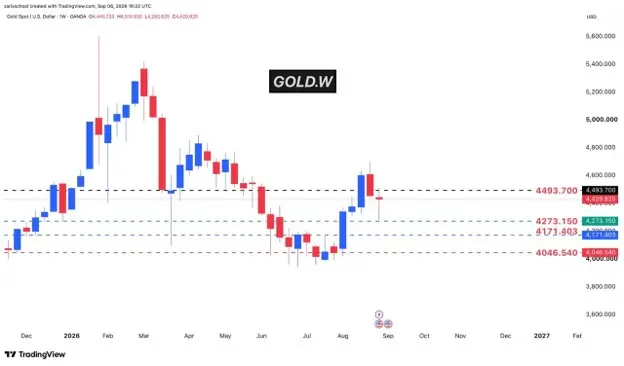
Gold is beginning September with a clear tension between its weekly and daily structures.
On the weekly chart, price has formed what may become a meaningful top. That top is not fully confirmed yet, but the current structure keeps the downside scenario active while gold remains below $4,493.70.
That level is the main dividing line in my view.
As long as weekly price action stays below it, I would continue to treat rallies with caution. The lower levels around $4,273.15, $4,171.40, and $4,046.54 remain relevant if selling pressure expands.
A weekly close above $4,493.70, however, would materially weaken this bearish interpretation. At that point, the case for renewed upside would become stronger.
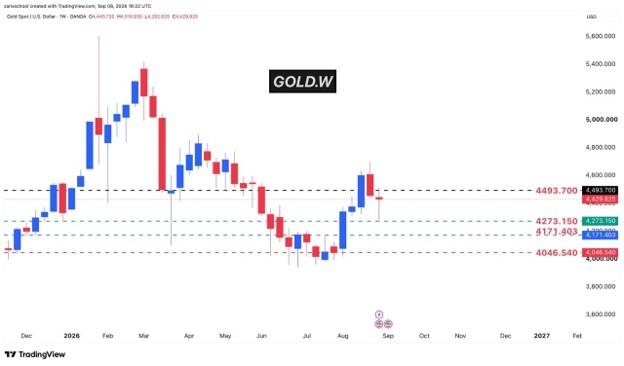
Gold weekly chart showing the developing top below $4,493.70 and lower support levels at $4,273.15, $4,171.40, and $4,046.54.
The Daily Chart Still Has Room to Rebound
The daily chart is less bearish than the weekly chart.
Gold has already reacted from the support area around $4,328–$4,317, and that reaction leaves room for another move higher before the market decides whether the weekly correction is finished.
This is important because a short-term rally would not necessarily mean the broader bearish scenario has failed.
My base case is that gold could still move higher from the current region, but that rebound may simply be part of the process of preparing for another sell phase.
The next area I would watch on the upside is around $4,560–$4,580.
That zone sits below the major high at $4,656.46, and at this stage I see a clean break above $4,656 as the less likely outcome.
In other words, the daily chart can still produce strength, but I would not automatically interpret that strength as the start of a new sustained bullish leg.
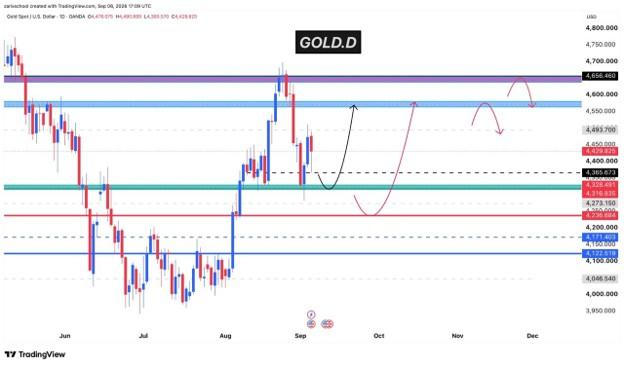
Gold daily chart showing the current rebound structure, support around $4,328–$4,317, and resistance below the $4,656 high.
Two Scenarios From Here
The first scenario is a relatively shallow pullback.
If gold continues to hold the current support structure around $4,365–$4,328, buyers may be able to push price back toward the $4,560–$4,580 resistance area.
That would still fit within the broader weekly bearish setup if price eventually fails there.
The second scenario involves a deeper correction first.
If current support breaks, the next area I would monitor is around $4,273–$4,236. A strong reaction there could still produce a recovery back toward the same upper resistance zone.
The distinction matters: I am not treating either support area as an automatic buy level. The reaction itself has to confirm that buyers are actually defending it.
What Would Change the Outlook?
For the weekly bearish view to lose credibility, I would want to see gold close above $4,493.70 on the weekly chart and then hold that improvement.
That would shift attention back toward $4,560–$4,580 and eventually $4,656.46.
Until that happens, I continue to view upside moves as potentially corrective rather than structurally bullish.
At the same time, the weekly top is not fully confirmed yet, so I would not treat the downside path as certain either.
The market is currently sitting between those two conditions: a weekly structure that still favors downside risk and a daily chart that may have enough strength for one more rebound.
Key levels
- $4,656.46 — major resistance
- $4,560–$4,580 — primary upside reaction zone
- $4,493.70 — key weekly decision level
- $4,365–$4,328 — near-term support/reaction area
- $4,273–$4,236 — deeper support
- $4,171.40 — secondary weekly support
$4,046.54 — deeper weekly support
