

Following the Federal Reserve's widely anticipated decision to raise the fed funds rate by a quarter point, taking the target range to 3.75%–4.00%, the perceived hawkish tone from the chairman led traders to price in roughly a 50% chance of another 0.25% increase at the next FOMC meeting, set to take place in about 42 days. The move helped the US dollar post its largest daily gain since June, rising 0.67% against a basket of foreign currencies to close back above the 100 mark at 100.31. The result was gold futures falling by just over $30, or 0.71%, on the day, enough to push gold beneath its simple 50-day moving average.
This short-term moving average is what market technicians use to judge whether a stock or commodity is in a bullish or bearish trend — above it is bullish, below it is bearish. There are, of course, many other variables involved in correctly labeling a market's short- or long-term trend, and while today's close below the 50-day SMA may, at first glance, look like meaningful chart damage, another technical study suggests that as long as gold can hold its current level of support, it remains very much in a mid- to long-term bullish trend calling for higher prices from here.
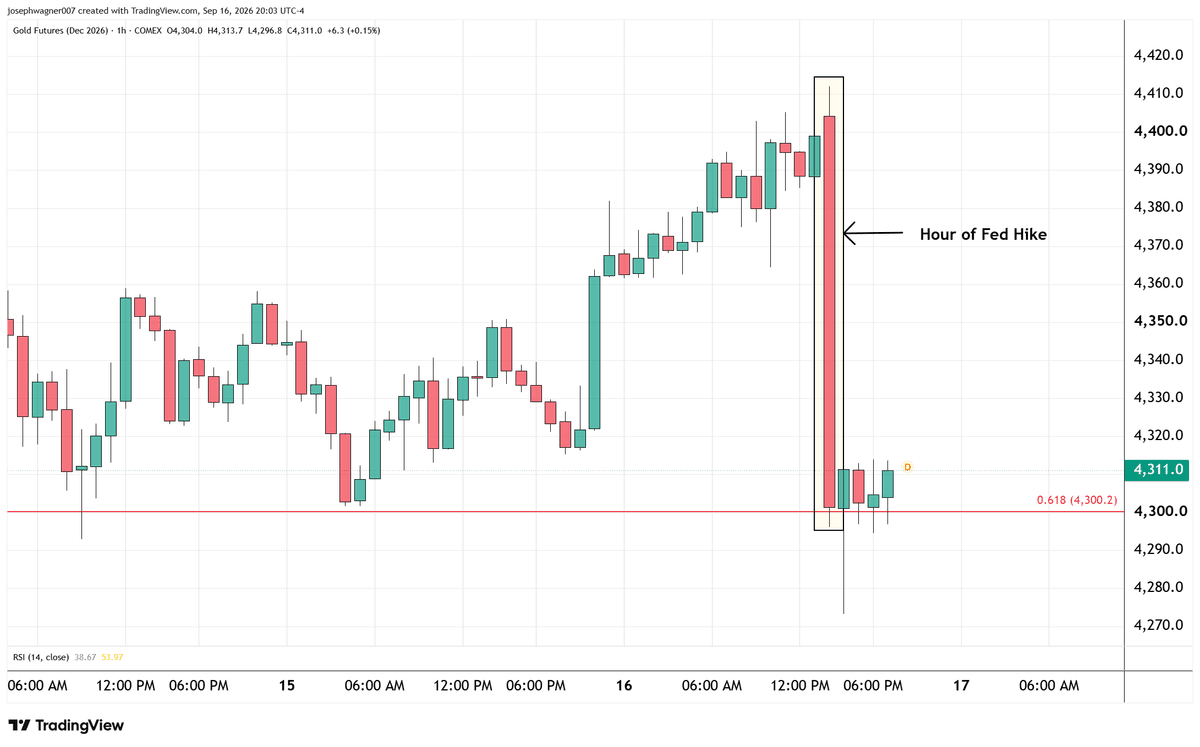
Viewed through an hourly candlestick chart, today's price action was far more nuanced than a simple decline. From the open, gold drifted a few dollars below its opening price of $4,368 before gradually climbing into the 2:00 PM ET candle, which contained the rate decision, with the press conference following halfway through at 2:30 PM ET. By 2:00 PM ET, gold had risen $36 from its opening price and $51.60 off its low of the day. In the hour containing the decision, however, gold fell by almost $100, and over the remaining two hours of Wednesday's session the bulls and bears fought a tug-of-war that ultimately left gold futures closing right back where the 2:00 PM candle had ended — an intriguing price to settle at, and one where our next study comes into play.
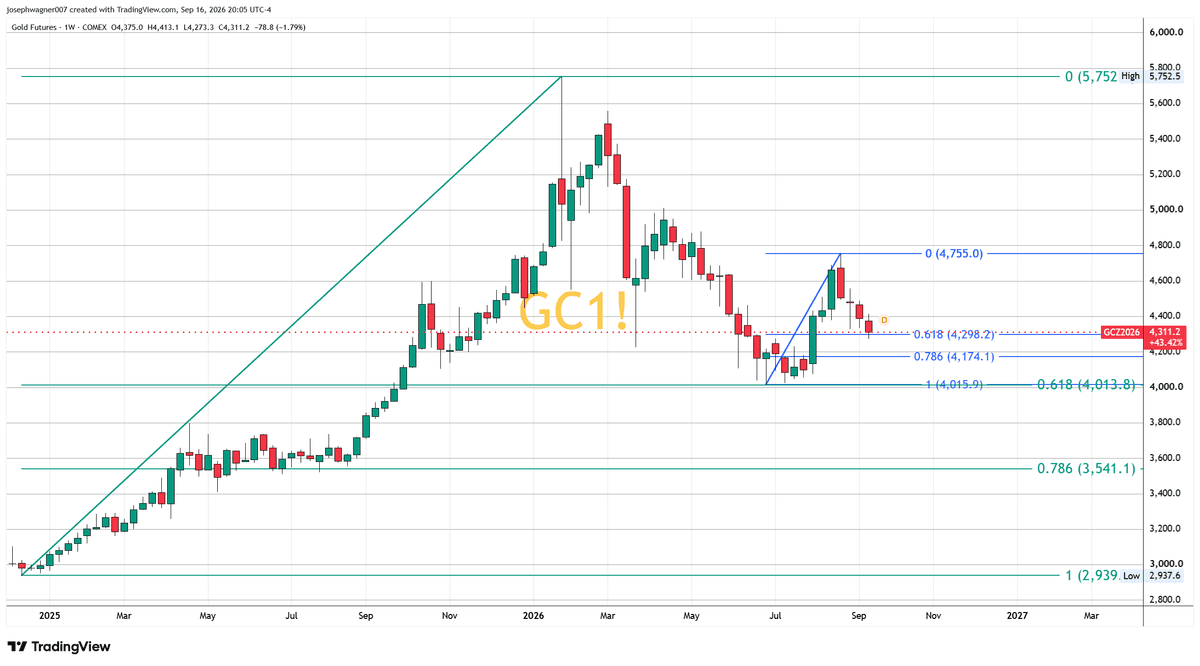
Zooming out to a weekly time frame and going back to the start of the 2026 rally — from the low of the second week of December at $2,939 to the highs made in the last week of January 2026 at $5,752 (on a continuous futures contract) — the pullback that followed that move to our all-time highs saw gold retrace precisely to its 61.8% Fibonacci level at $4,013. A market correcting 61.8% after a massive move is an acceptable level for a market that remains in a bullish trend. Now, running a Fibonacci retracement on gold's summer rally — from the low made in the last week of June, at $4,015 (matching the longer-term 61.8% level), to the recent high at $4,755 — the 61.8% retracement comes in at $4,298, three dollars below where gold fell to immediately after the rate hike and closed out the day.
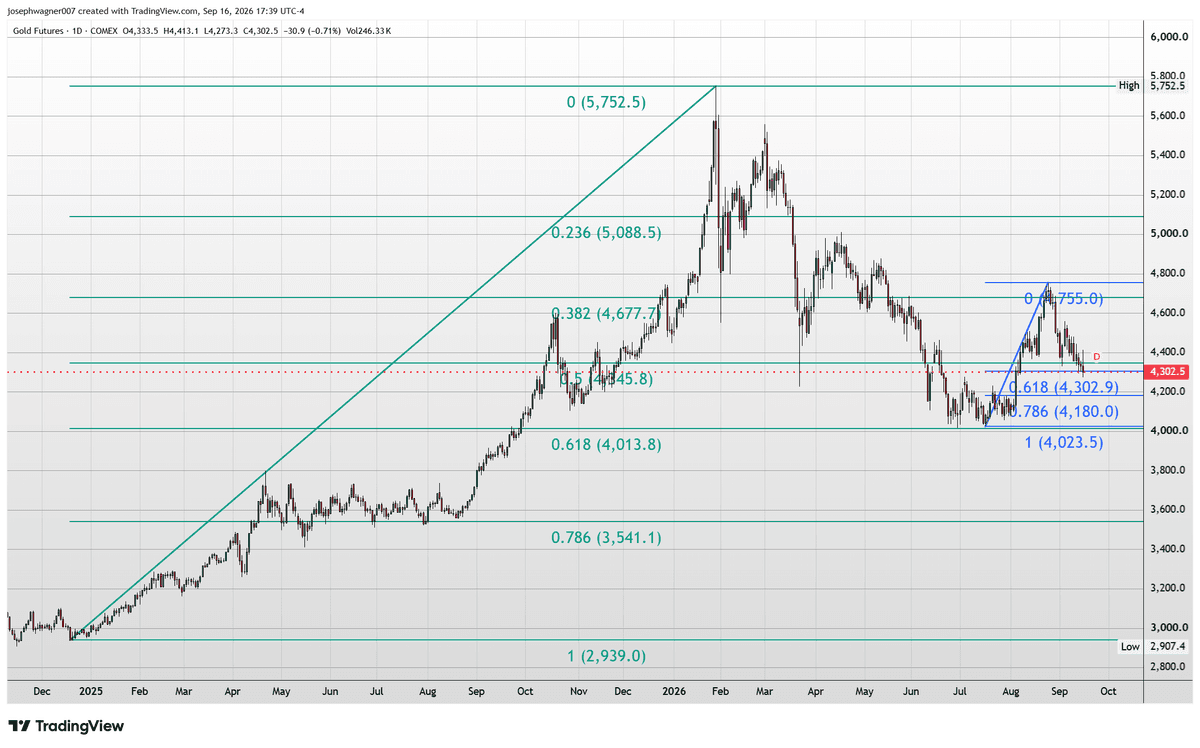
In conclusion, this study suggests gold remains in a mid- and long-term bullish trend. Today's low, while below the 50-day SMA, came in right around the 61.8% retracement level — just as it did in the longer-term data set going back to the end of 2024. The caveat is that gold must hold this level on a closing basis to confirm the pattern, which would call for higher prices from here. At the time of writing (7:05 PM ET), gold is flirting with this key level; the most important thing is the closing price, so even if we see a wick beneath $4,298, as long as we close above it on the daily candle, this pattern remains in play.
The next 42 days will do plenty to test that thesis. The FOMC's updated dot plot showed 16 of 18 officials still penciling in at least one more hike before year-end, with four looking for two, so the path of least resistance for Fed policy remains tighter rather than looser even after today's move. That keeps the dollar and Treasury yields as gold's chief headwinds heading into the October 27–28 meeting, while sustained central-bank buying, an elevated geopolitical risk premium, and the market's own long-term uptrend continue to underwrite the bid on every dip toward these Fibonacci shelves.
For now, the level to watch is $4,298 on a closing basis. Reclaim and hold above it, and the path of least resistance points back toward the 2:00 PM high near $4,404 and, eventually, a retest of the $4,755 summer top. Lose it on a closing basis, and the longer-term 61.8% shelf near $4,013 becomes the next line of defense. Markets rarely move in straight lines, but the fact that gold's own math keeps landing on the same numbers, hike after hike, headline after headline, is a reminder that beneath all of the day's noise, there is still an underlying order worth paying attention to.
