
Yesterday, the Federal Reserve raised interest rates for the first time in three years, delivered a hawkish message, and gold sold off. If that sounds familiar, it should. In December 2015, Janet Yellen raised rates for the first time in nearly a decade, gold fell to a multi-year low of $1,050 on the day of the hike, and every headline called it a disaster for the metal. Gold never traded that low again.
Over the next three years after that December 2015 hike, as the Fed raised rates nine more times, gold rose 14% by year-end 2018. Go back further to June 2004, when Alan Greenspan's first hike marked gold's bottom at $380 an ounce. What followed was a 400% rally through 2011 to nearly $1,900. The pattern is consistent: by the time the Fed actually moves, the fear is already priced in.
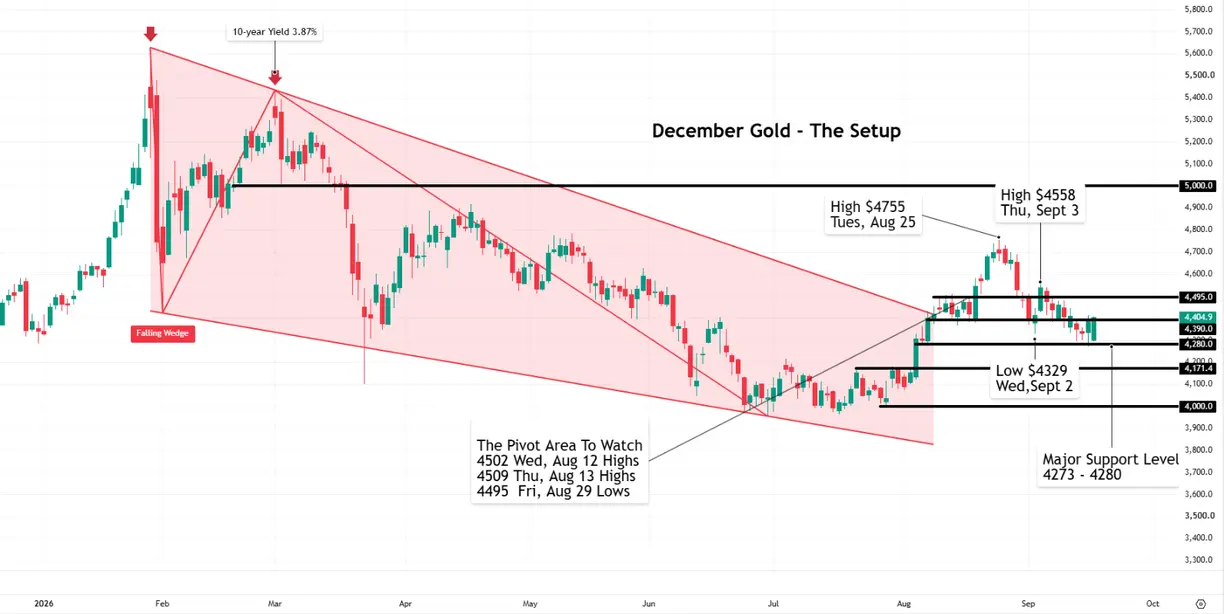
That is exactly what we may be watching unfold right now. December Gold futures spent two weeks absorbing every piece of bad news the market could throw at them, with a hotter-than-expected PPI, 10-year yields hitting 5.00% for the first time since 2007, and a Fed hiking cycle the market had fully priced in heading into yesterday's decision. Gold tested $4,273 on Monday and held. Silver tested $63.00 over four consecutive sessions and held every time on a closing basis. A market that refuses to break down after absorbing all that is not weakness; it's strength.
This morning, the September hike is now in the rearview, and the market has already moved on to the next question: does the data cooperate enough to slow or pause the cycle from here? The odds of a follow-up hike at the October 28 meeting currently sit at 55%, which tells you the market is not convinced the Fed is done but is pricing in a much more measured path than the relentless tightening it feared all week. That shift in expectations is constructive for gold. A data-dependent Fed that slows its pace as inflation eases is a fundamentally different backdrop than the aggressive hiking path the bond market was pricing when the 10-year hit 5.00% on Monday. Oil is pulling back toward $96 as Saudi Arabia works to restore a key pipeline and diplomatic talks are scheduled for next week, removing the inflation premium that had been the Fed's cover for staying aggressive.
Every Sunday in our Navigating the Week Ahead report, we map the key levels and setups before the trading week opens so you are positioned for the next leg instead of chasing it. Sign up here.
December Gold Chart
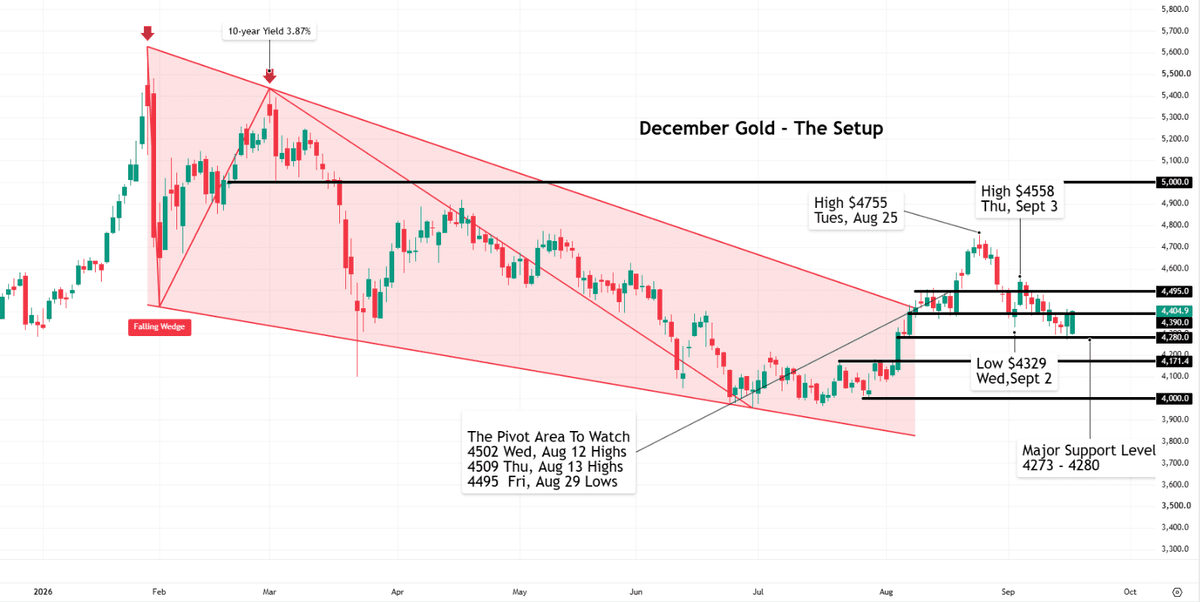
The levels that matter from here are straightforward. On the downside, $4,273 to $4,280 is the zone that has now been tested and held, and we view any pullback toward it as the opportunity. On the upside, $4,390 is old support turned resistance and the first line the market needs to reclaim. A close above it puts the 100-day moving average at $4,412 in play, and beyond that the pivot area between $4,495 and $4,509 is what opens the door for a retest of the September 3 high at $4,558. The longer-term case for $5,000 remains intact as long as the Fed's pace slows with the data. ETFs have added gold for seven straight sessions through yesterday's hike, including 162,500 troy ounces on Fed day itself.
Performance Disclaimer
Hypothetical performance results have many inherent limitations, some of which are described below. No representation is being made that any account will or is likely to achieve profits or losses similar to those shown. In fact, there are frequently sharp differences between hypothetical performance results and the actual results subsequently achieved by any particular trading program.
One of the limitations of hypothetical performance results is that they are generally prepared with the benefit of hindsight. In addition, hypothetical trading does not involve financial risk, and no hypothetical trading record can completely account for the impact of financial risk in actual trading.
For example, the ability to withstand losses or to adhere to a particular trading program in spite of trading losses are material points that can also adversely affect actual trading results. There are numerous other factors related to the markets in general or to the implementation of any specific trading program that cannot be fully accounted for in the preparation of hypothetical performance results all of which can adversely affect actual trading results.
