

(Kitco Commentary) - November 18, 2026. Altcoins outside the top ten just cleared a level I’ve been watching, even as Bitcoin’s daily momentum remains deeply oversold. A recovery in price and a recovery in market share are two different things. Today’s charts show why that distinction matters.
Bitcoin’s first bounce still has something to prove
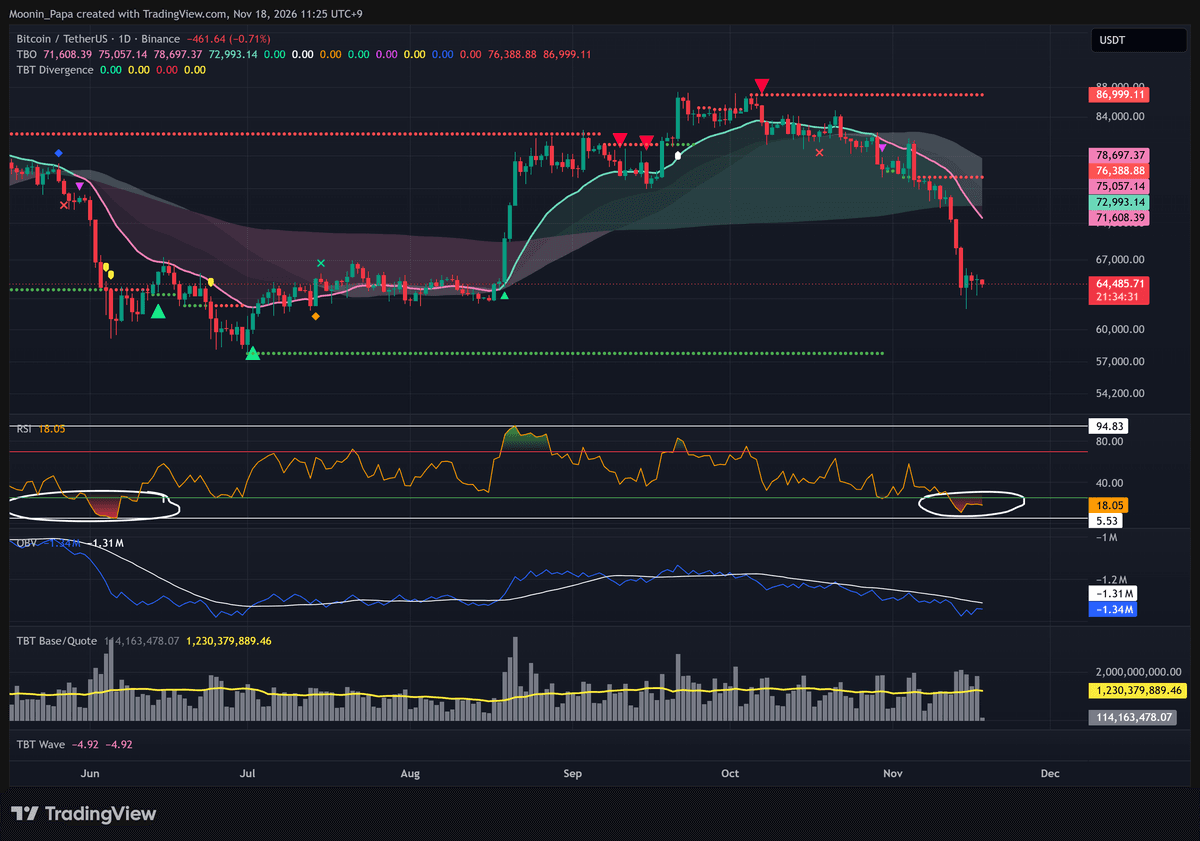
Bitcoin has spent six consecutive days oversold on the daily relative strength index (RSI). The indicator measures momentum. It can stay depressed while price keeps falling. The next change I’m watching is a bullish RSI reset. As of Wednesday’s analysis, it had yet to confirm.
February and June offer an uncomfortable precedent. In both drops, price had room for an initial bounce and then another low. If that sequence repeats here, a move toward $60,000 is possible. Even a confirmed reset would be an early reversal signal. The behavior of price on the pullback after a bounce would tell us more.
Ether has room to rally and still retest $1,700
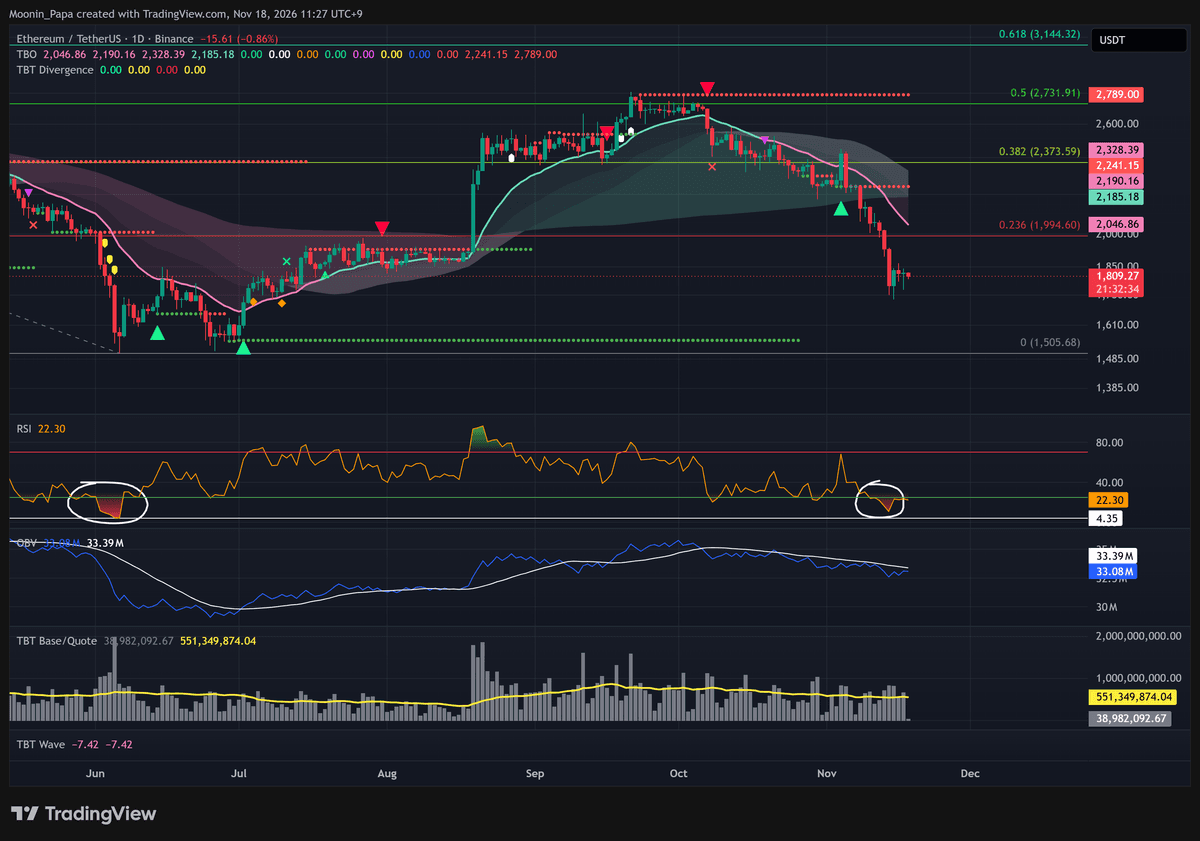
Ether’s first test on a recovery would be the 0.236 Fibonacci retracement, just under $2,000. Reaching that area would fit a relief bounce. It would also leave open a later return to $1,700.
To judge Ether’s relative strength, switch from ETH/USDT to ETH/BTC. The dollar chart could recover while Ether continues to lag Bitcoin. On the ratio chart, I’m still waiting for a push into the TBO Cloud.
Stablecoin dominance sends different signals on two timeframes
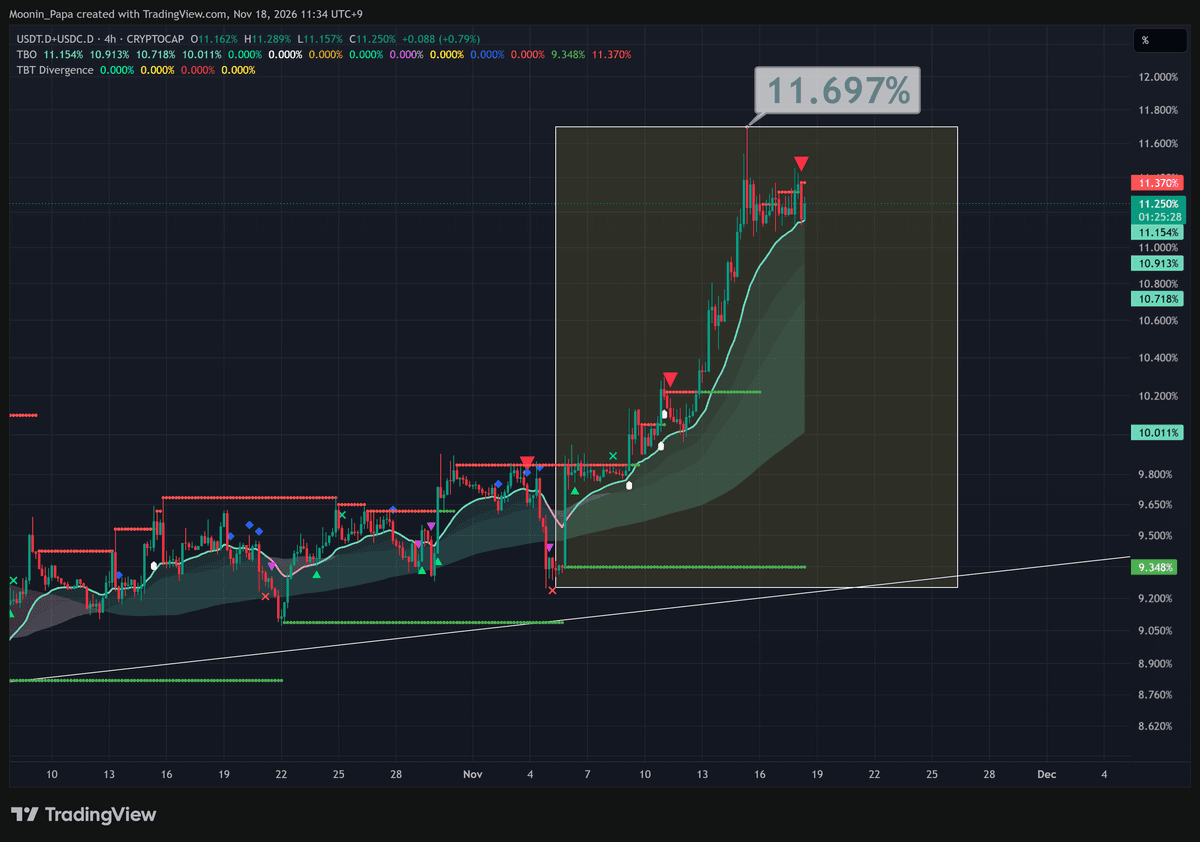
The combined share of Tether and USDC remains above its daily Cloud with overbought RSI. That is still a strong bullish trend for stablecoin dominance. A pullback in their share would give Bitcoin and altcoins room for relief.
Zoom in to four hours and a TBT Bearish Divergence has printed. The indicator’s Slow line still points to macro strength. The shorter signal is a reason to watch for a retracement. The daily chart shows why it is too early to assume that retracement has already changed the trend.

Altcoins clear their Cloud as Bitcoin dominance goes oversold
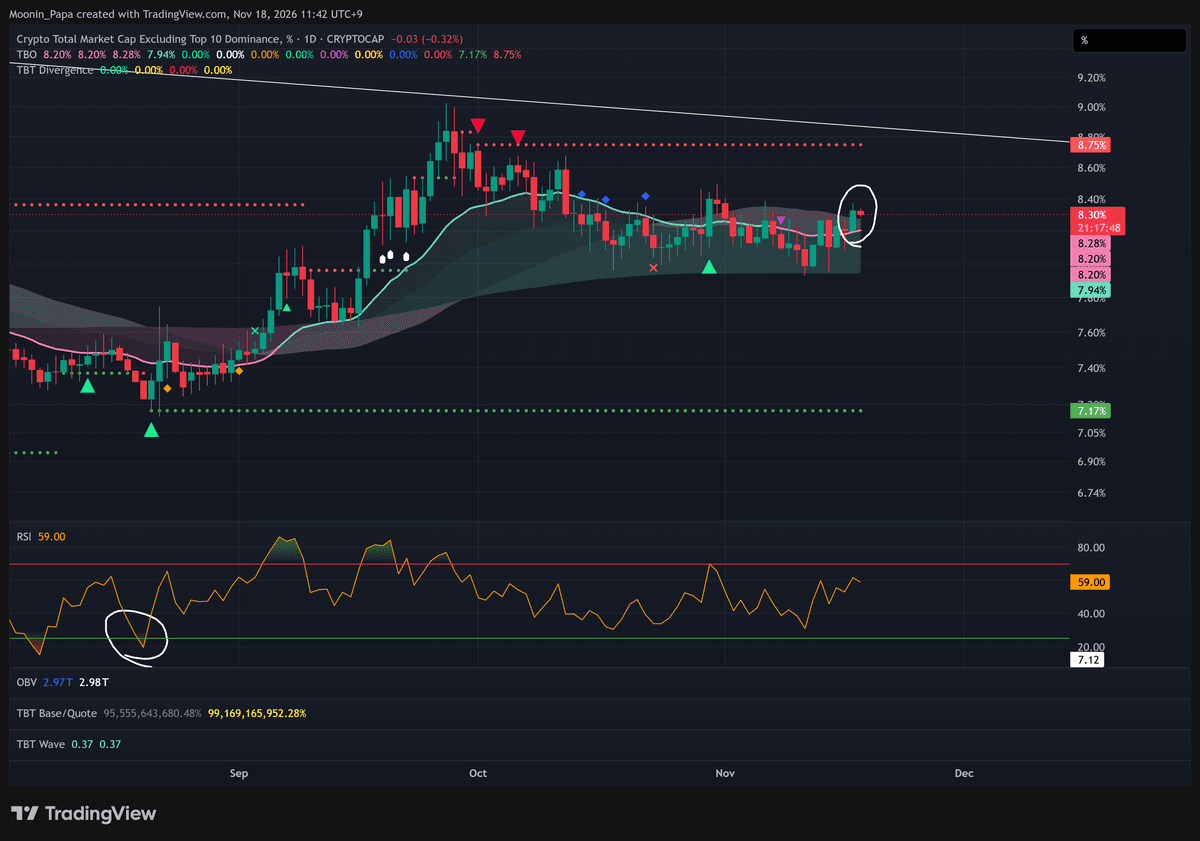
On Tuesday, OTHERS.D closed above its daily Cloud. This chart measures the share of total crypto market capitalization outside the top ten. The close moved it into strong bullish territory. In dollar terms, the OTHERS market-cap chart still reads strong bearish. Altcoins can gain share even in a falling market.
Bitcoin dominance is the counterweight. Its daily RSI has gone oversold, so a rebound in Bitcoin’s share could quickly interrupt the altcoin move. On the weekly BTC dominance chart, a Close Long signal is still developing. I’m watching which move holds before assuming altcoins will lead a broader recovery.
The dollar index reaches a Mature reading
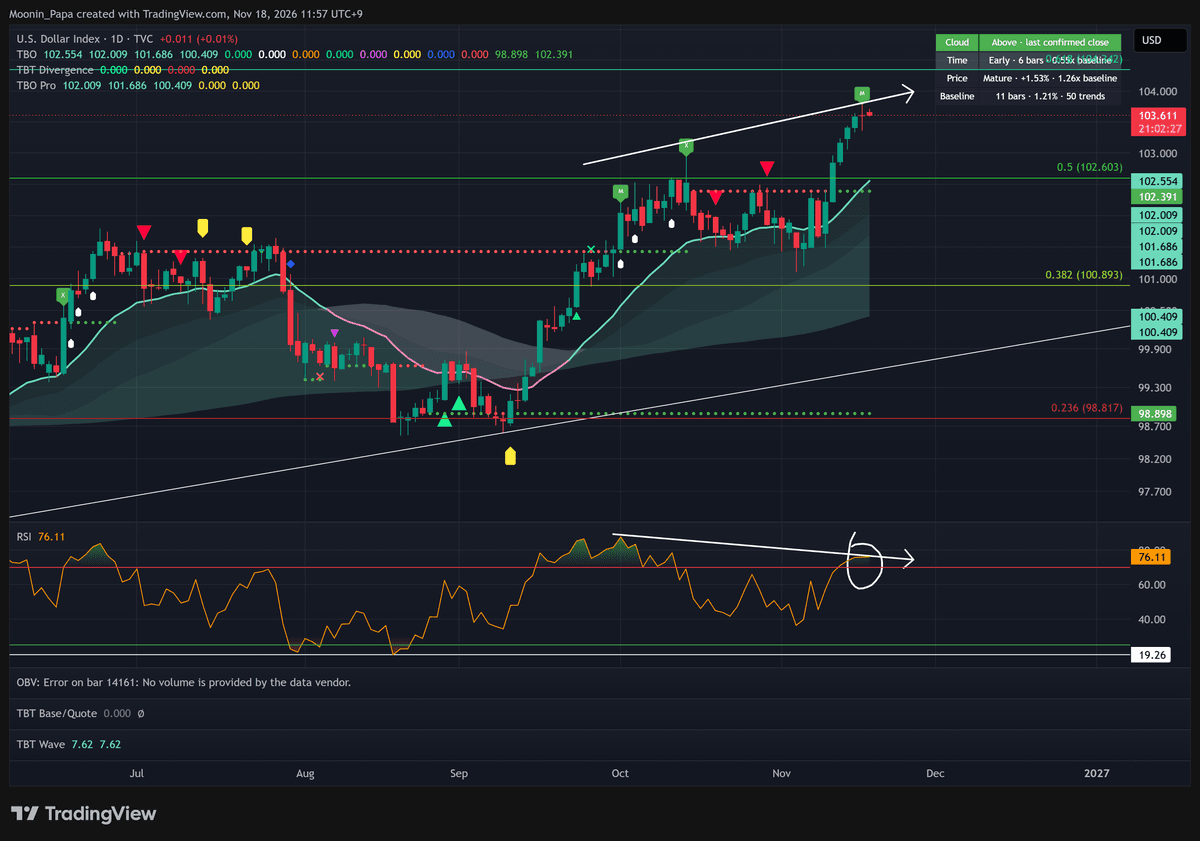
The U.S. Dollar Index confirmed a TBO Mature reading for its price above the daily Cloud. A move back toward the Cloud would give the euro and yen room to bounce. The rating describes how stretched the move has become. It leaves the timing of a pullback open.
Equities add a separate caution. S&P futures have returned to TBO Support and still read strong bearish, while the Nasdaq 100 printed a Breakdown on Tuesday. With the VIX around 25 and its extension at 1.54 times baseline, even a retreat in volatility would leave those equity signals to work through.
Solana’s June comparison comes with a condition
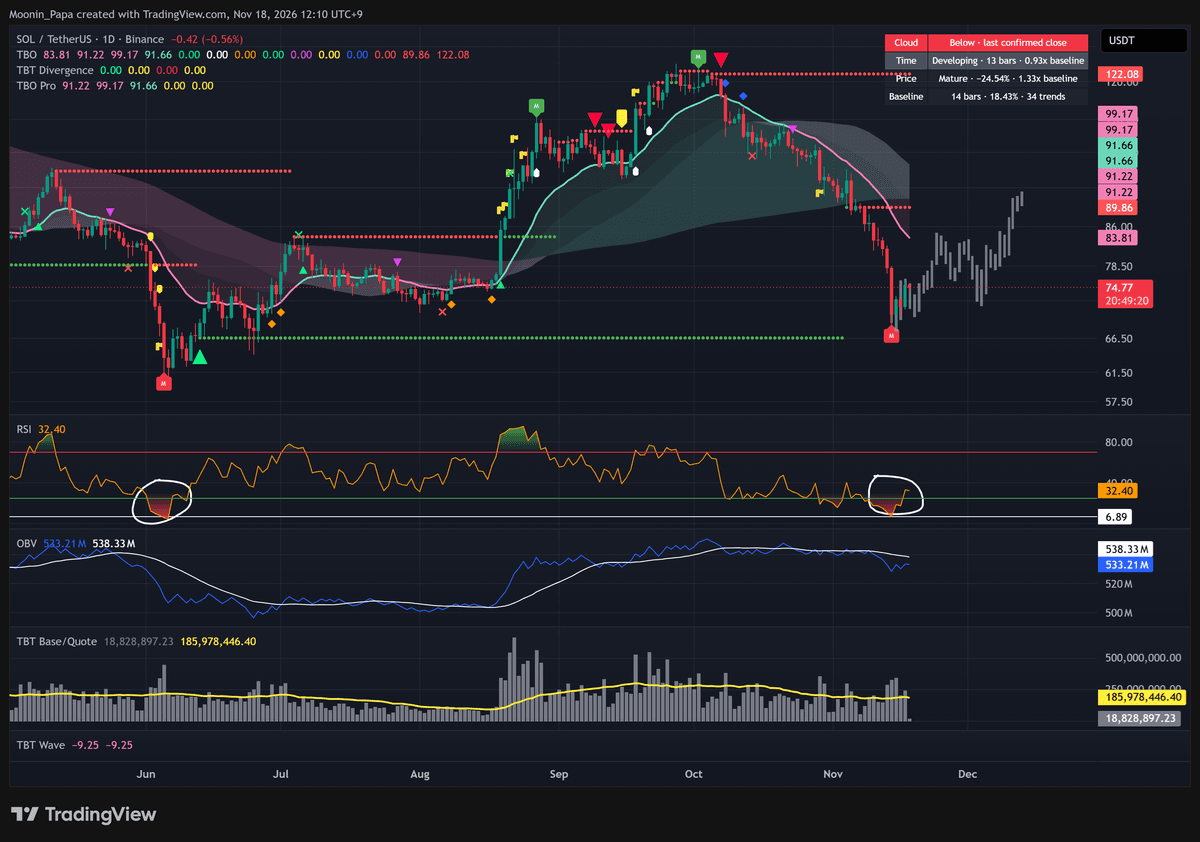
Solana’s daily price chart is tracing a recovery that resembles June. If that comparison continues to hold, $92 could come into view over the next couple of weeks. The gray comparison on the chart illustrates that scenario. The candles to its left are the price history.
There is a second piece of evidence. SOL dominance rose 4.57% on Tuesday and printed a TBT Bullish Divergence alongside a rising Slow line. That is a move in market share, distinct from SOL’s dollar return. The broader dominance chart is still bearish after its oversold stretch. I want to see that early strength persist, particularly if Bitcoin dominance rebounds.
Learn my strategies and the tools I use every day by visiting The Complete Cryptocurrency Investor by Mastering Assets.
