
As this is my first article published in 2026, I'd like to take a moment to reflect on my journey with Kitco, which began back in 2007 during my early days at Lind-Waldock. I want to express my gratitude to both the readers and the staff for all the positive feedback I've received over the years. I truly enjoy collaborating with many of you in the futures and commodities sector. It has been rewarding to see that some of the ideas presented in my articles have inspired you to open trading accounts with Blue Line Futures, where you have successfully executed them alongside your own ideas, not only in precious metals but also in various other commodities. Thank you all for your support!
As we look ahead to the first quarter of 2026, we expect further price appreciation in the precious metals market, along with increased volatility. With rising price volatility comes more noise surrounding these assets. You are already familiar with the fundamentals of asset classes like copper, gold, and silver. Now, it's essential to focus on the signals rather than the noise, and this is where technical analysis comes into play.
To help you develop a trading plan, I reviewed 25 years of my trading strategies and created a free resource: the "5-Step Technical Analysis Guide." This guide outlines all the technical analysis steps you need to create an actionable plan for entering and exiting the market. You can request your copy here: 5-Step Technical Analysis Guide
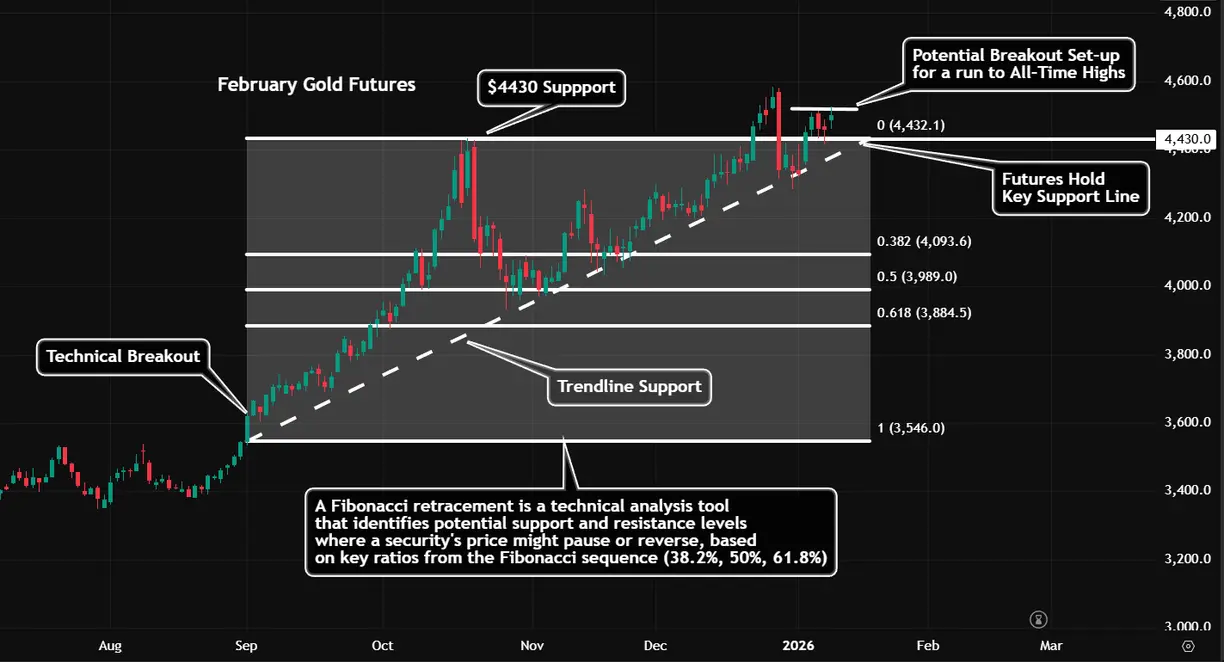
Daily Gold Chart
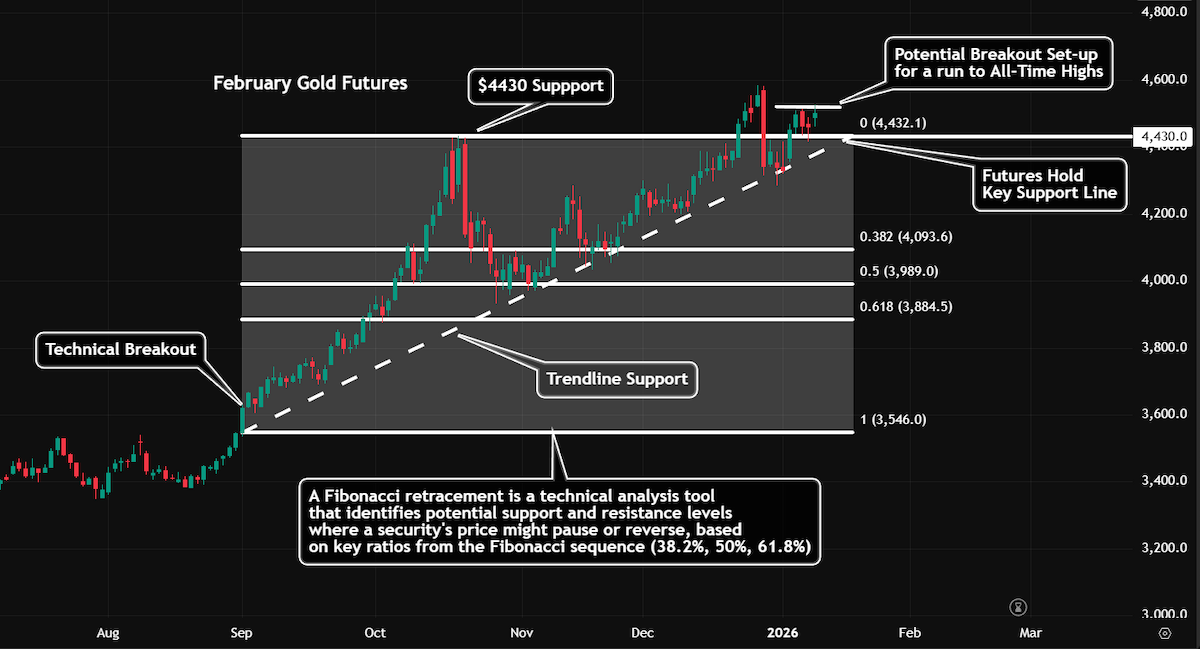
The latest upward movement in futures began in late August 2025, driven by several factors including concerns about US tariffs, a weak dollar, expectations of easier monetary policy, and central bank purchases. An analysis of the chart reveals a technical breakout in early September, when futures surged to the $4,300 per ounce mark before retreating to the 50% Fibonacci retracement level. At this level, trendline support began to develop, leading to another push toward new all-time highs. As of now, futures are consolidating between $4,430 and $4,530. A potential breakout above $4,550 could pave the way for a move to $5,000.
Daily Silver Chart
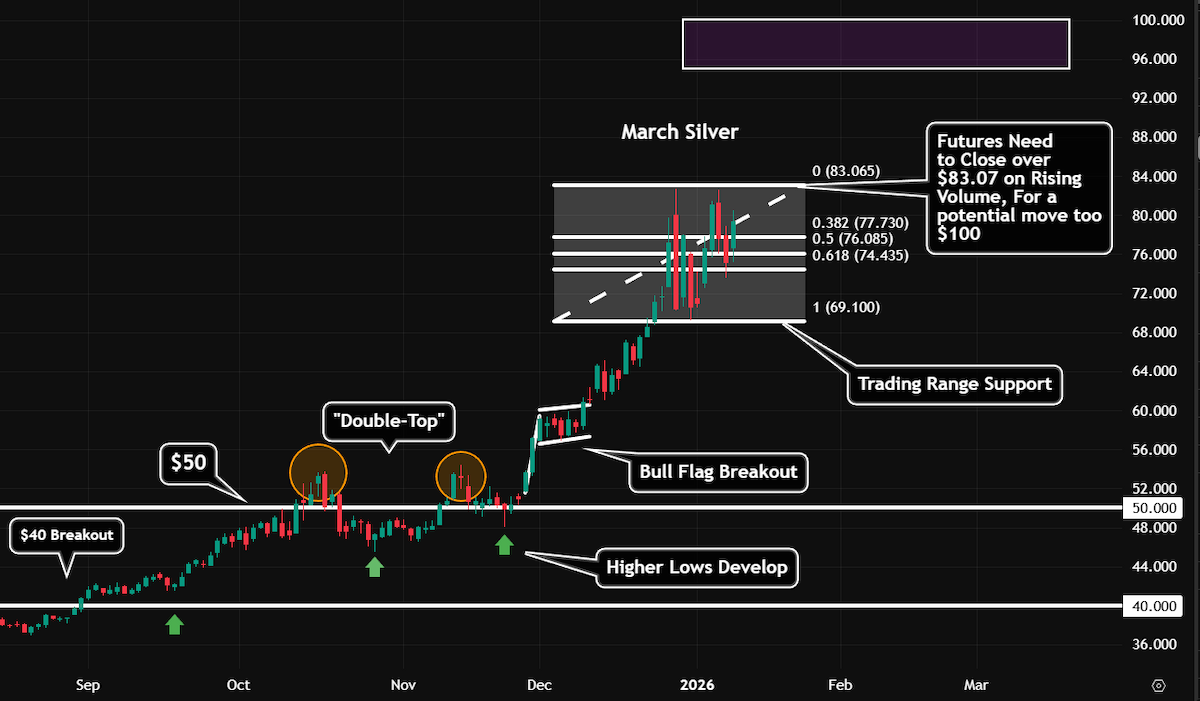
Similar to gold, silver experienced a remarkable surge in 2025, adhering to some of the same basic technical analysis principles. After breaking through key resistance levels of $40 and $50 an ounce, futures reached a double top before forming a bull flag. This bull flag was subsequently broken, adding fuel to the rally until prices reached $82.67. Currently, a definable trading range has emerged between $69.10 and $83.07. We believe that a potential breakout above this range could pave the way for prices to reach $100 an ounce.
Technical analysis and chart pattern recognition can simplify your trading decisions, and there are various interpretations of these patterns, making technical analysis both an art and a science. The key lies in identifying these patterns while implementing a trading strategy based on your predictions of future movements. Whether you are a trader or long-term investor in precious metals, you should familiarize yourself with basic chart patterns and develop a solid plan that could give you an advantage. By combining different technical analysis chart patterns across various time frames, you can truly harness the potential of the futures and commodities markets. Staying ahead of the Silver market has never been easier. Get the Blue Line Futures Precious Metals Chart Pack today by registering here: Get Precious Metals Chart Pack