

Bitcoin Technical Outlook
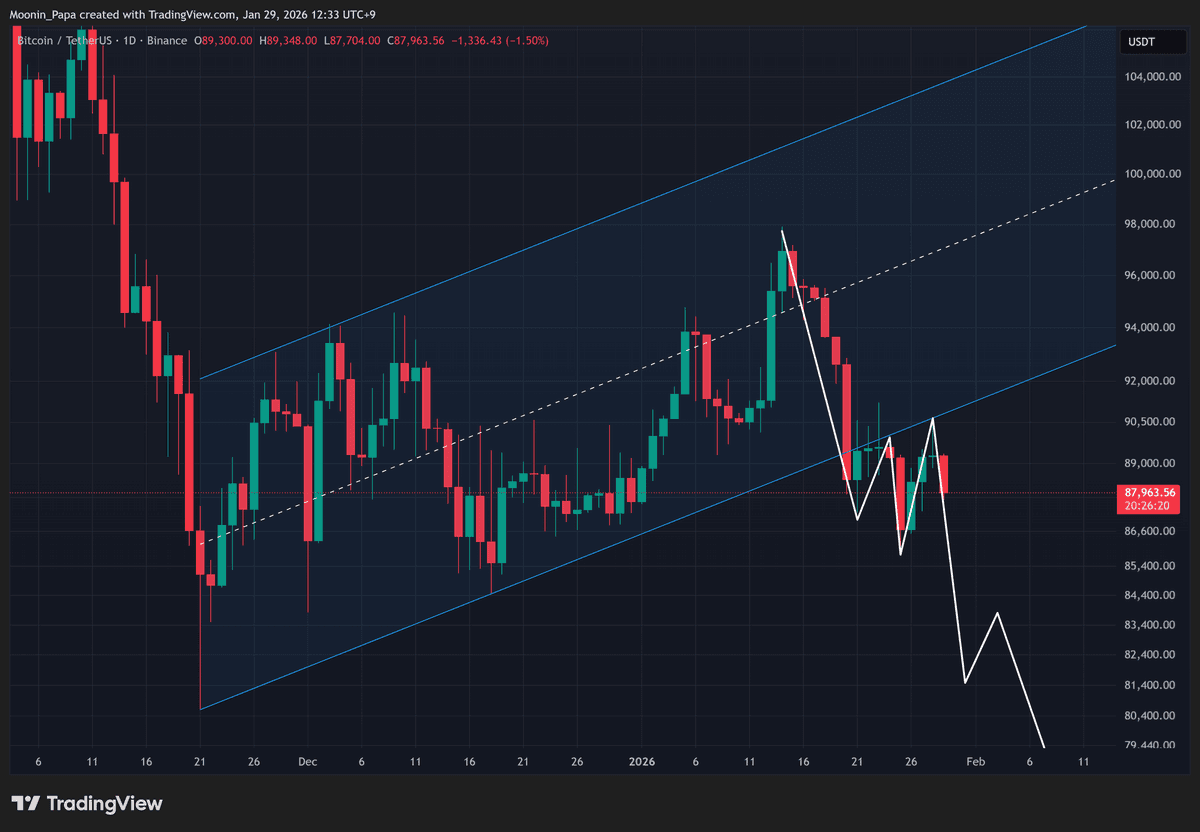
Bitcoin tagged the daily TBO Fast line but failed to close above the daily TBO Cloud, maintaining a “strong bearish” mode. After a −1.5% drop today, the upper wick from yesterday has turned prior support into resistance, confirming a bear-flag continuation pattern. The technical setup favors another move lower toward $86,000 rather than an upside breakout.

Ethereum Behavior & ETH/BTC Ratio
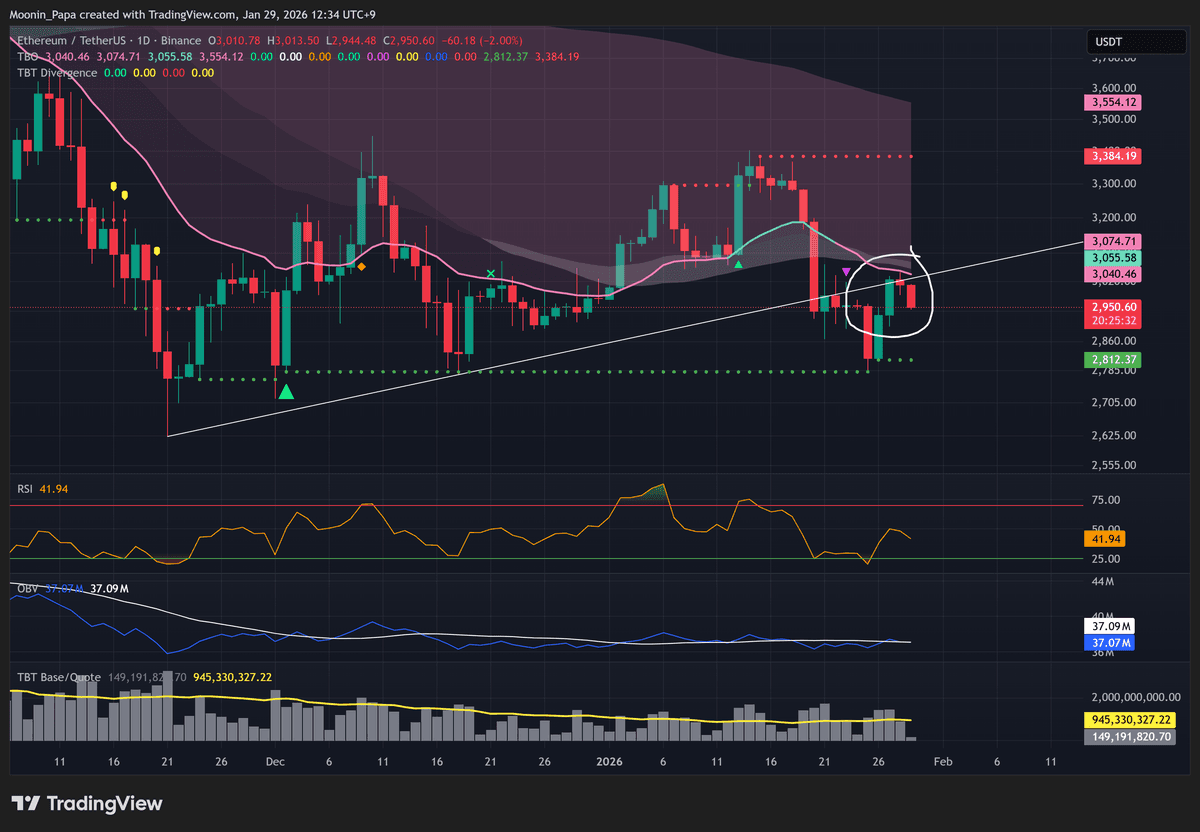
Ethereum mirrored Bitcoin’s weakness, briefly reclaiming but failing to hold the daily TBO Fast line and now trading down 2% toward TBO support near $2,800. The recent bullish bounce lacked sufficient momentum, and daily RSI is weakening. On Tuesday, a TBO Close Short signal was confirmed, and with ETH underperforming in today’s sell-off, the ETH/BTC ratio is headed lower toward its TBO support at 0.03201.
Market Dominance Metrics
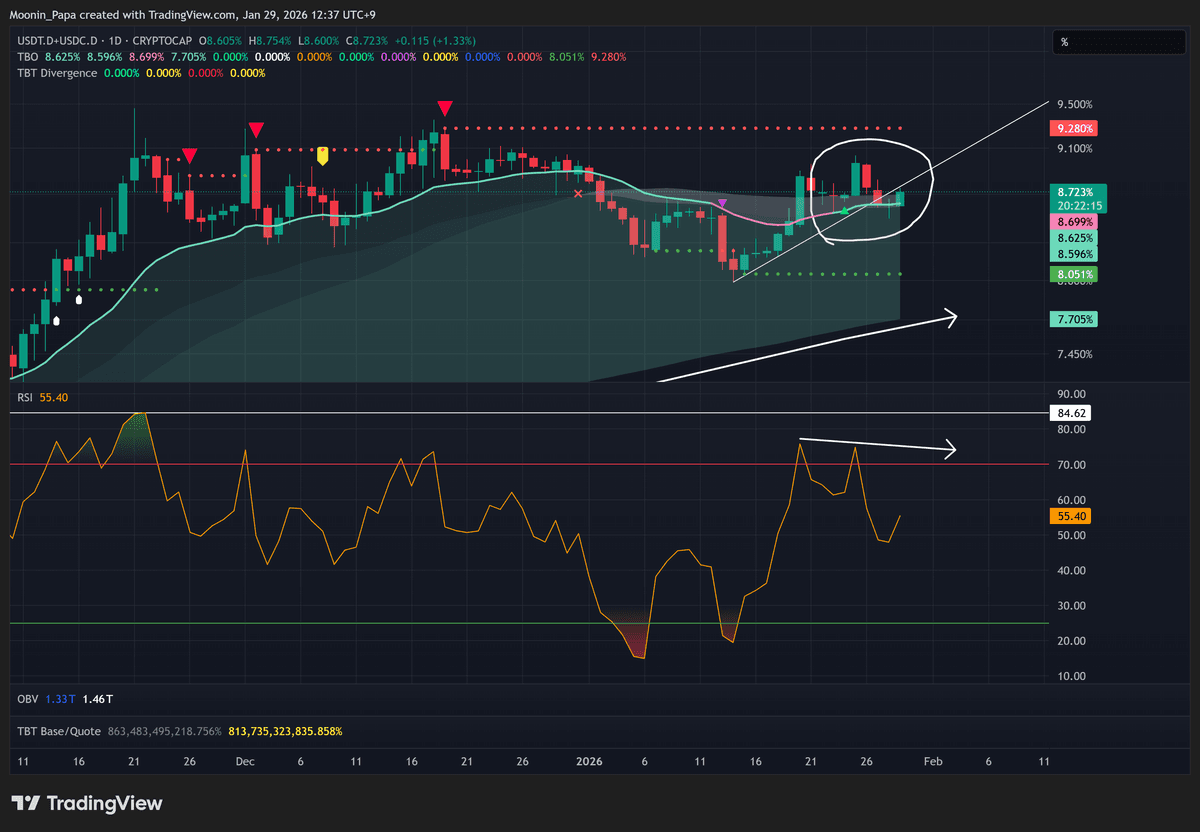
Combined stablecoin dominance showed bearish divergence ahead of the latest pullback, allowing a brief crypto bounce. Now that Bitcoin has resumed its decline, stablecoin dominance is rising again. A sustainable bullish reversal would require a close above short-term resistance, but the TBO Slow line remains strongly upward, indicating a macro bullish trend that typically coincides with crypto weakness.
Bitcoin dominance (BTC.D) retraced into the daily TBO Cloud—“bearish consolidation”—and is likely to trend lower through the bear market. OTHERS.D’s recent TBO Open Long appears to be a false signal, and TOTALES.D, after tagging the TBO Fast line, is set to fall back to its support level. Macro indicators such as OBV also remain bearish across these indices, so counter-trend moves should be treated as deviations rather than new uptrends.
Traditional Finance Overview
The US dollar index (DXY) posted a green close with a minor RSI reset but continues a strong bearish trend. As the dollar weakens, the euro has broken overhead resistance, and USD/JPY is moving lower. In equities, the S&P 500 briefly crossed above 7,000 despite a sub-75 RSI (62.8), while the Dow Jones Industrial Average printed a second TBT Bearish Divergence cluster, warning of an imminent pullback. Conversely, the Nasdaq 100 has cleared key resistance lines.
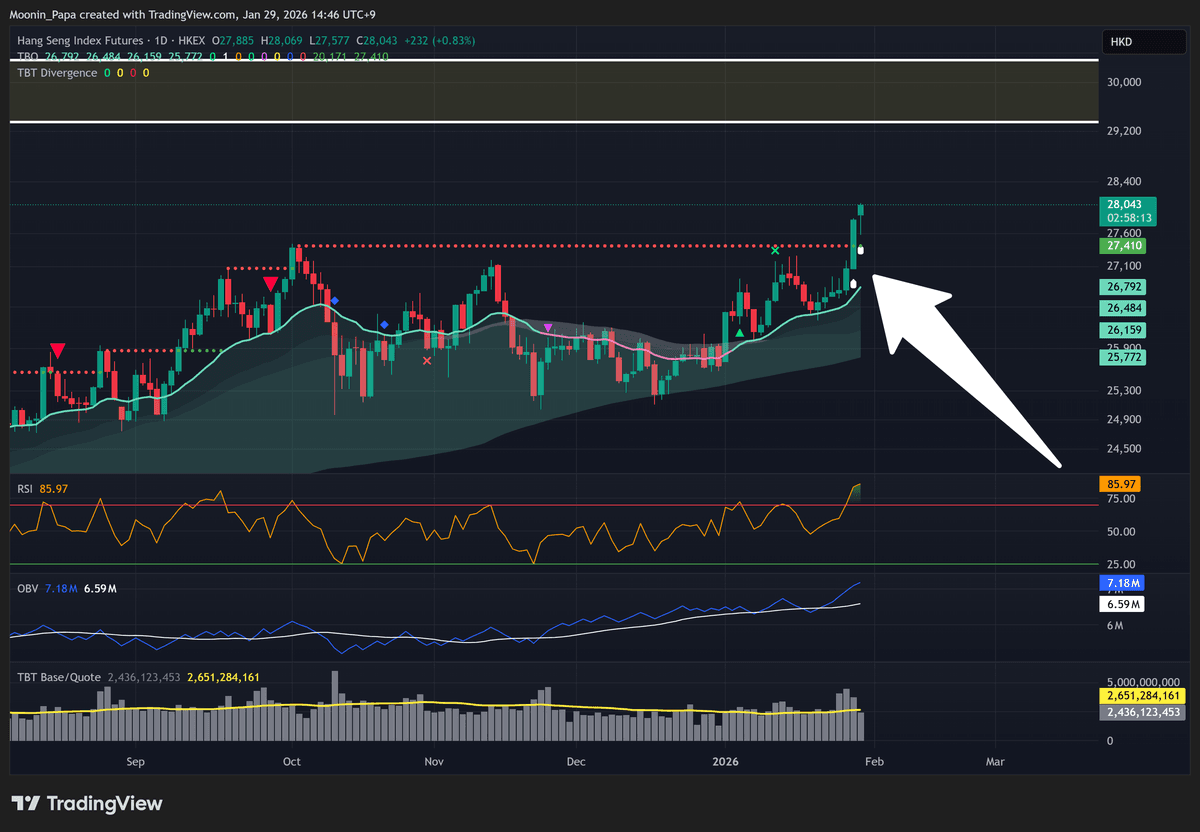
In Asia, the Nikkei is approaching daily TBO resistance at 54,100 on a falling RSI, the Shanghai Composite remains indecisive despite bullish momentum, and the Hang Seng has confirmed a second TBO Breakout above 30,000—a level not seen since early 2021, historically marking major tops.
Precious Metals Surge
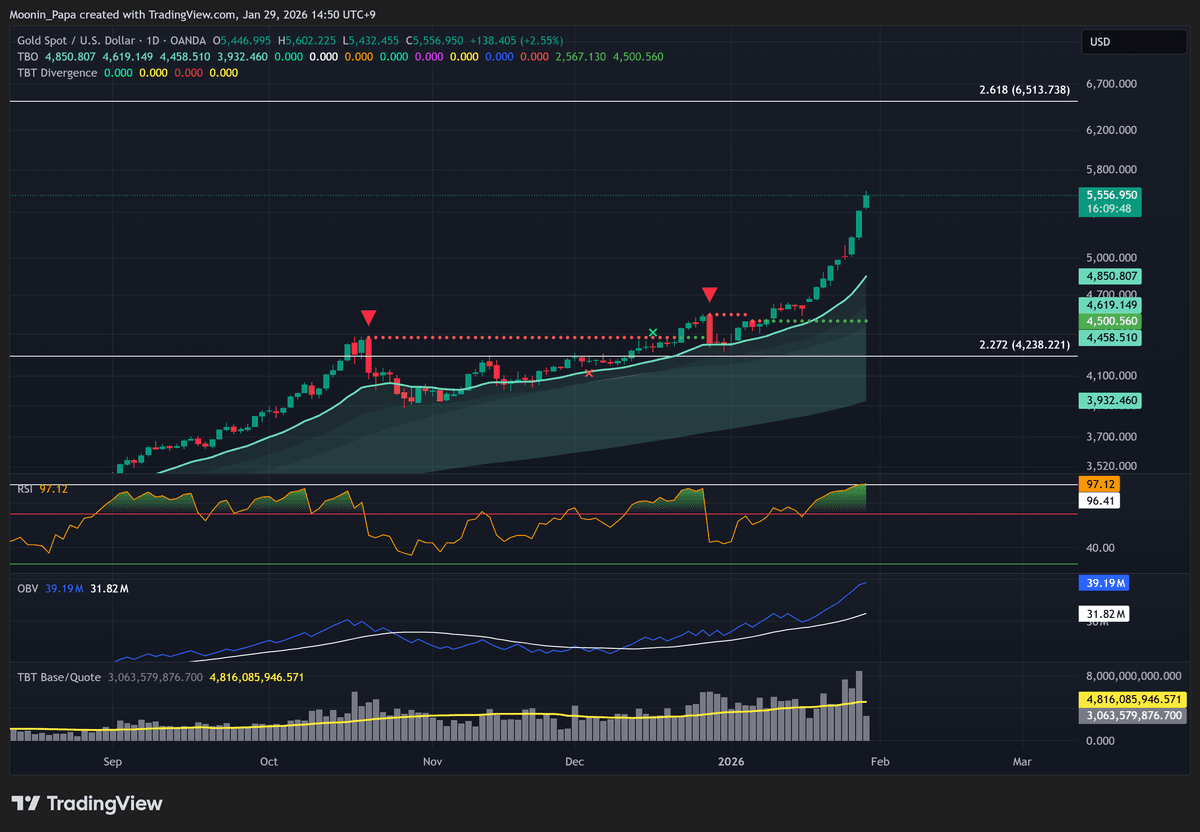
Brent crude futures saw a weekly TBO Close Short signal, echoing the previous rally’s peak. Gold, however, is in a parabolic uptrend, surging 4.6% in one session with an overbought RSI of 96.4. Key targets include the 2.618 Fib extension at $6,513, supported by rising TBO, OBV, and volume metrics. Silver follows a similar trajectory toward its 1.618 extension at $122, where volatility is expected, and copper is up over 4% as the broader metals sector rallies.
Altcoin Landscape and Risks
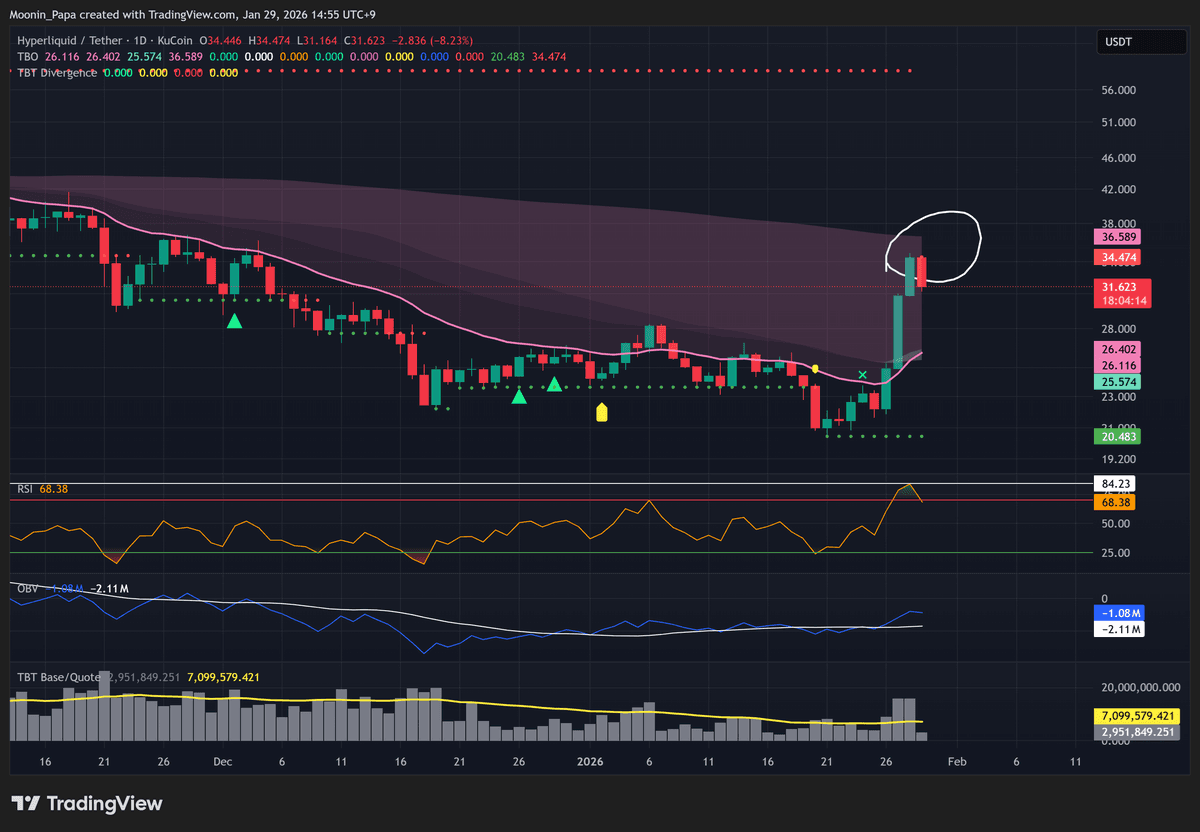
Most altcoins have succumbed to Bitcoin’s pullback, and charts such as LINK are teetering on their daily TBO support, poised to break if BTC revisits $86,000. Outliers like HYPE—now near the top of its daily Cloud with RSI above 80—should be treated as sell-into-rallies or short opportunities. Other tokens, including CHZ and RIVER, have shown repeated bearish divergence patterns with declining volume and RSI, offering additional entry points for shorts.
Conversely, extreme outliers such as STABLE, which is up over 30% today, underscore the importance of viewing counter-trend moves as isolated events rather than signals of a broader market reversal.
Learn my strategies and the tools I use every day by visiting The Complete Cryptocurrency Investor by Mastering Assets.
