

Bitcoin Price Action and Technical Outlook
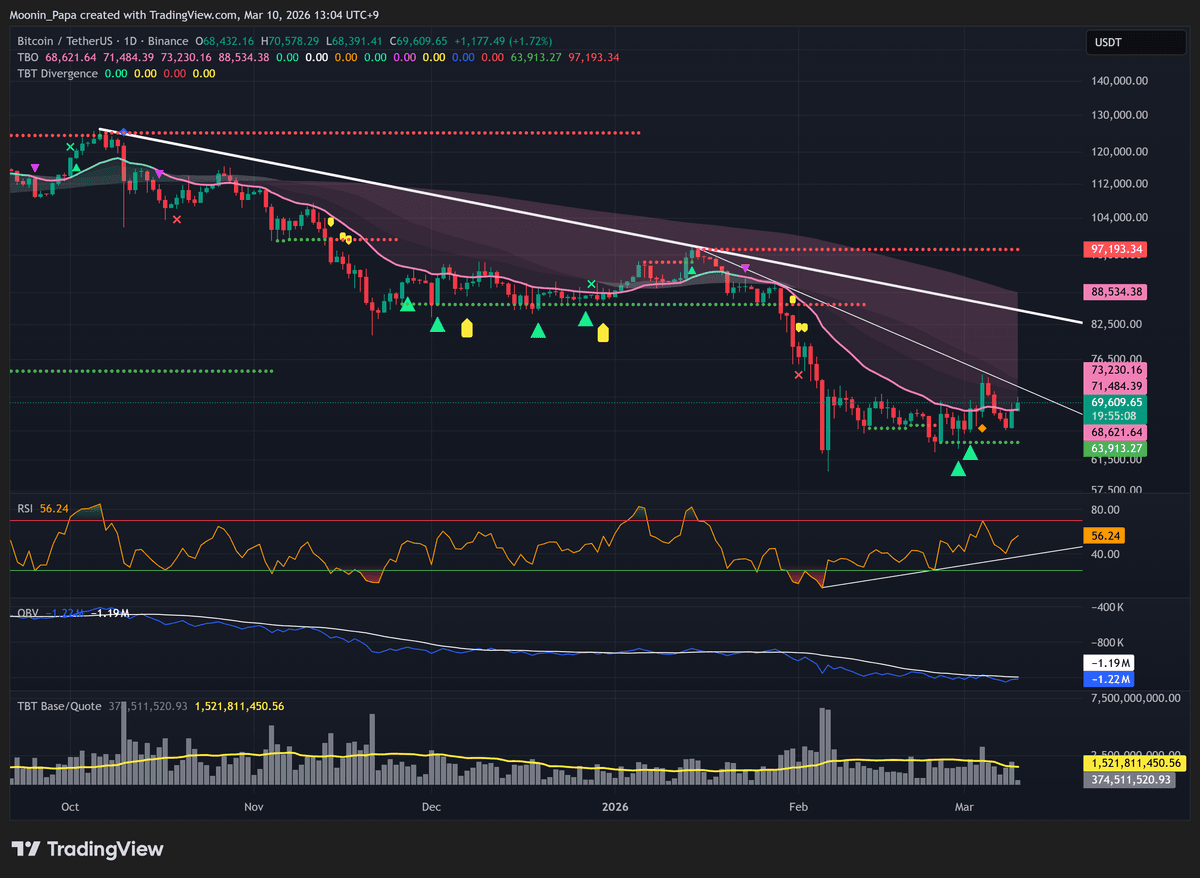
Bitcoin rebounded amid oil-driven volatility but failed to close inside the daily TBO Cloud, wicking within it—a setup that often leads to a retest of cloud support. Immediate resistance lies at the descending fan around $72,000; a sustained break above this level could trigger a push toward $74,000–$75,000, forming a classic bull-trap environment. Daily RSI remains below overbought territory, with a decisive move above 70 likely marking a pivot high and an attractive entry for short positions. Despite these short-term rallies, the chart retains a valid bear-flag pattern, suggesting eventual lower lows after any higher-high formation.
Ethereum and Crypto Market Structure
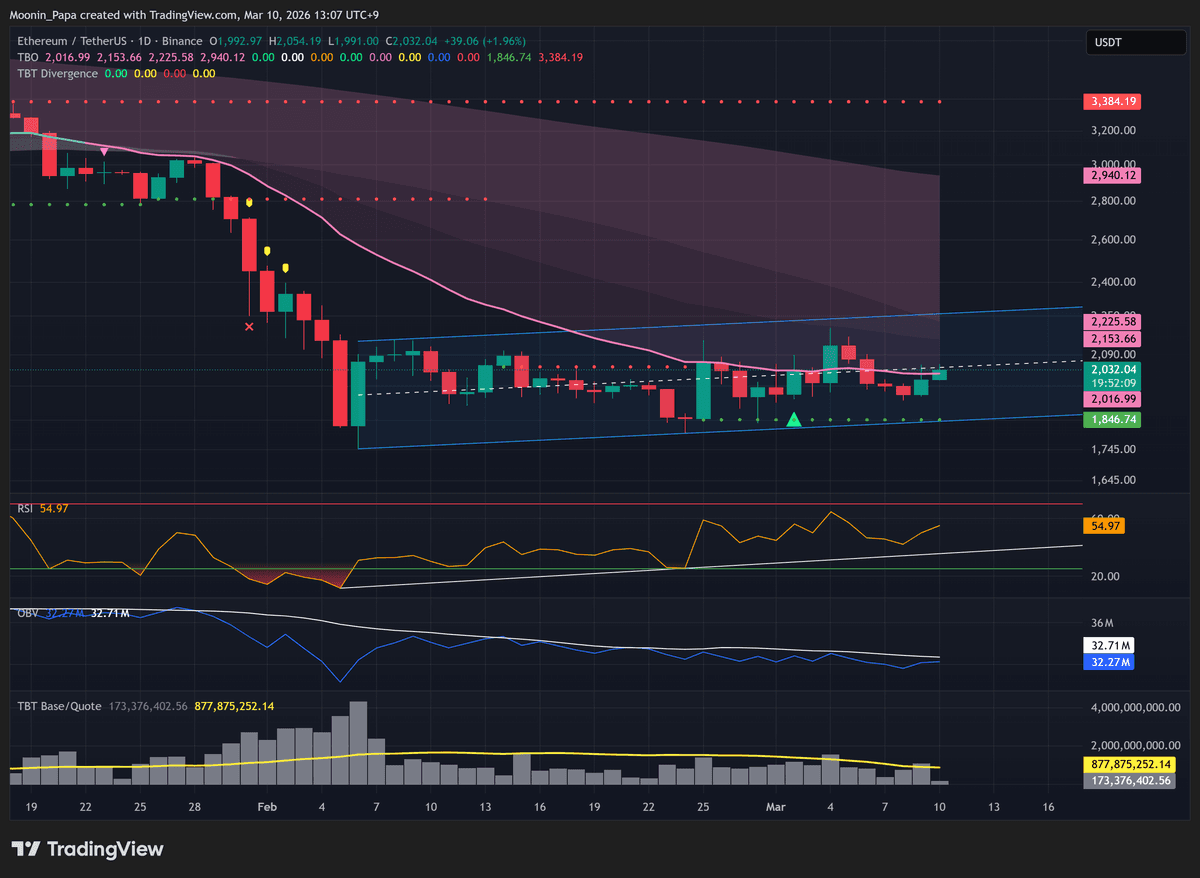
Ethereum mirrors Bitcoin’s macro bearish tone, with no significant change in price action. Yesterday’s volume spike above the 30-day moving average primarily reflects a declining MA since mid-February, not fresh buying. Should Bitcoin challenge $74,000–$75,000, ETH could retest $2,200, but both assets maintain bear flags that forecast higher highs followed by steeper sell-offs. Stablecoin dominance is slipping back into the daily cloud, and a drop in daily RSI below 25 would likely coincide with a broader crypto pivot into lower lows. Bitcoin dominance (BTC.D) also shows overbought RSI signals, pointing to a near-term downturn, while Top-10 dominance sits bearish below cloud support, exerting downside pressure on altcoins.

Altcoin Market Dynamics
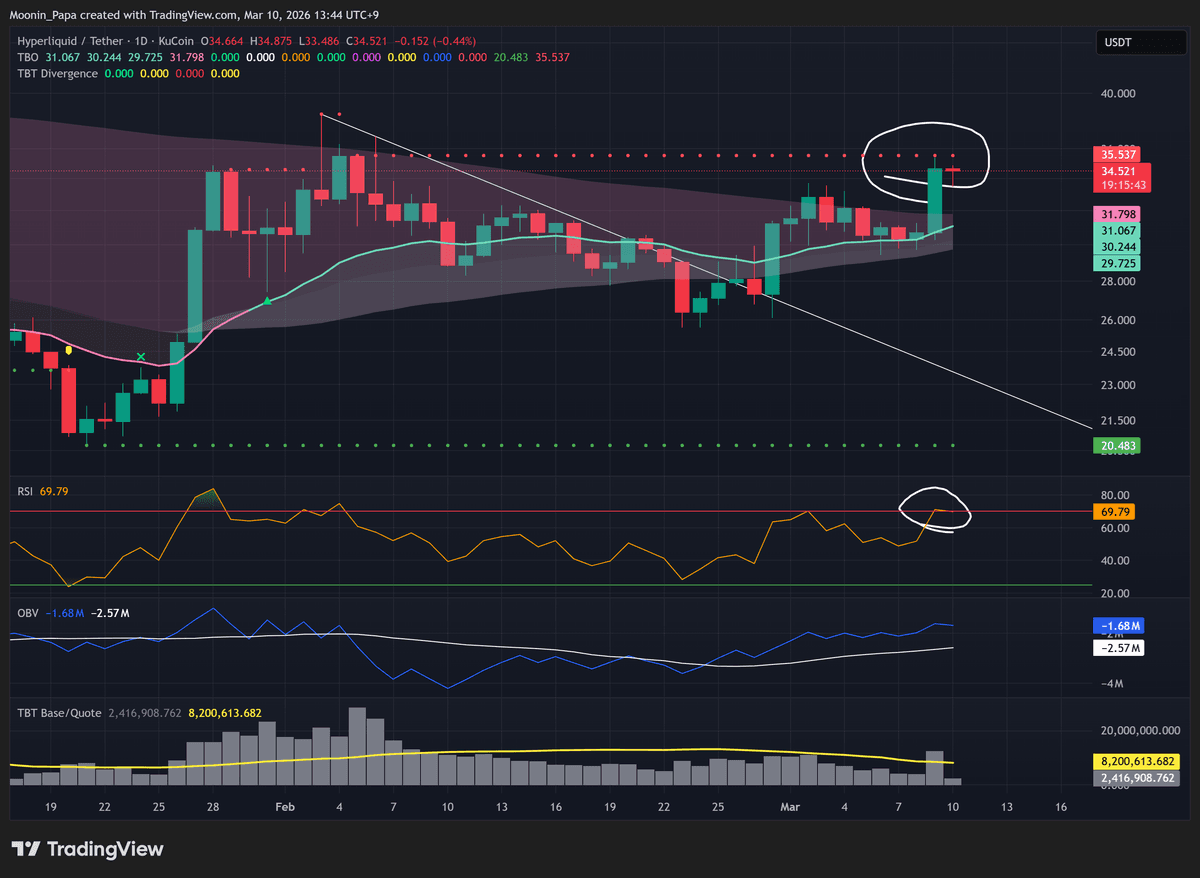
Altcoins face headwinds as market attention gravitates toward Bitcoin. While certain tokens—such as XRP, XLM and RIVER—display bullish divergence setups, most alt charts remain in bearish consolidation or testing TBO resistance with weakening volume and RSI divergences. SOL and HYPE have tested overhead levels but failed to secure closes, presenting short opportunities. Early bullish reversal alerts on TAO and Uranium suggest fleeting reprieves, yet broad alt performance is tethered to Bitcoin’s next major directional break, with any BTC failure likely triggering sharp altcoin declines.
Traditional Financial Markets and Macro Indicators
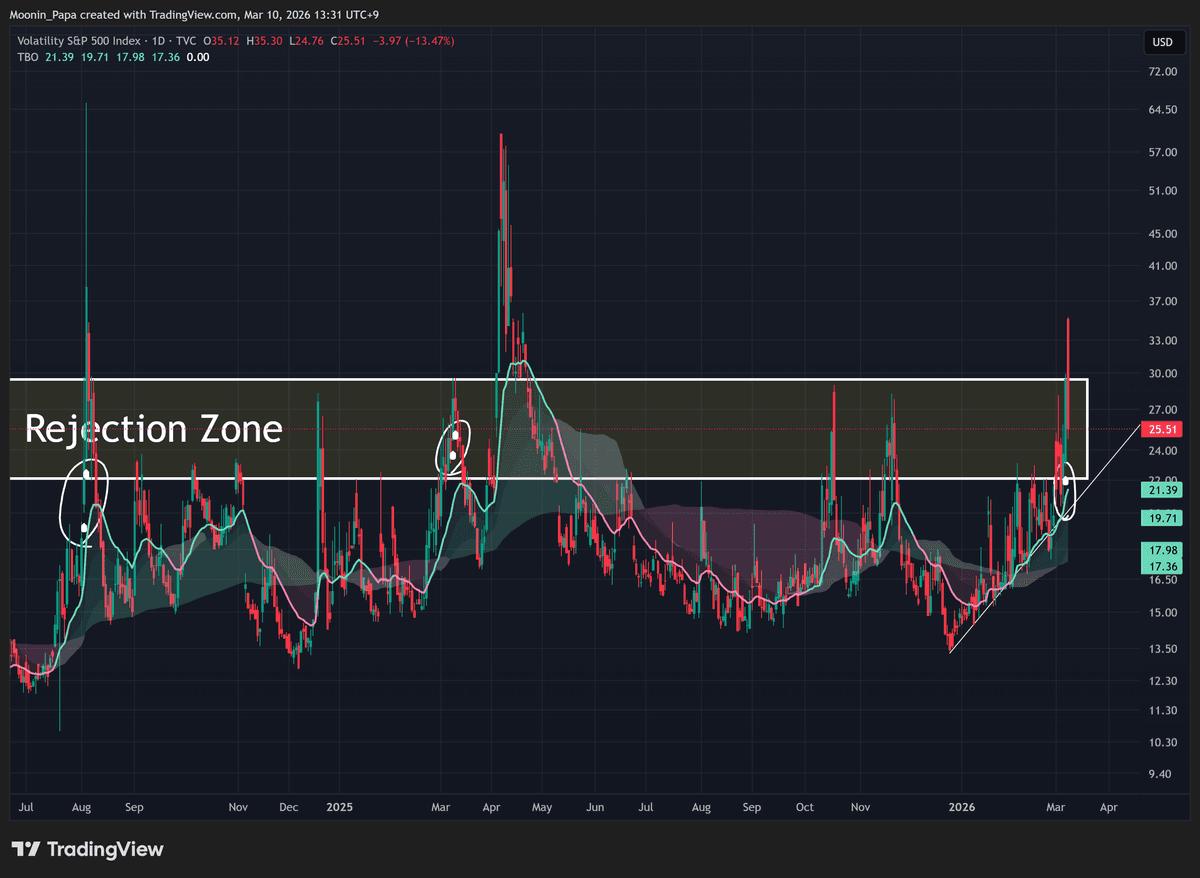
The US dollar index (DXY) made a local high before slipping on G7 oil release news, while the euro remains bearish below its daily cloud despite a bounce. USD/JPY’s push toward 159 was quickly reversed by intervention; weekly charts suggest a potential turn lower in USD/JPY, reinforcing a stronger yen. Equity indices remain in bearish consolidation: the S&P 500 faces an open short amid cloud compression, the Dow and Nasdaq exhibit oversold RSI readings, and the FANG index printed a second TBO Close Short. Elevated VIX readings signal persistent volatility. In Asia, the Nikkei’s second TBO Close Long warns of a pullback, and both Shanghai and Hang Seng remain under bearish pressure on daily and weekly frames.
Commodities and Precious Metals
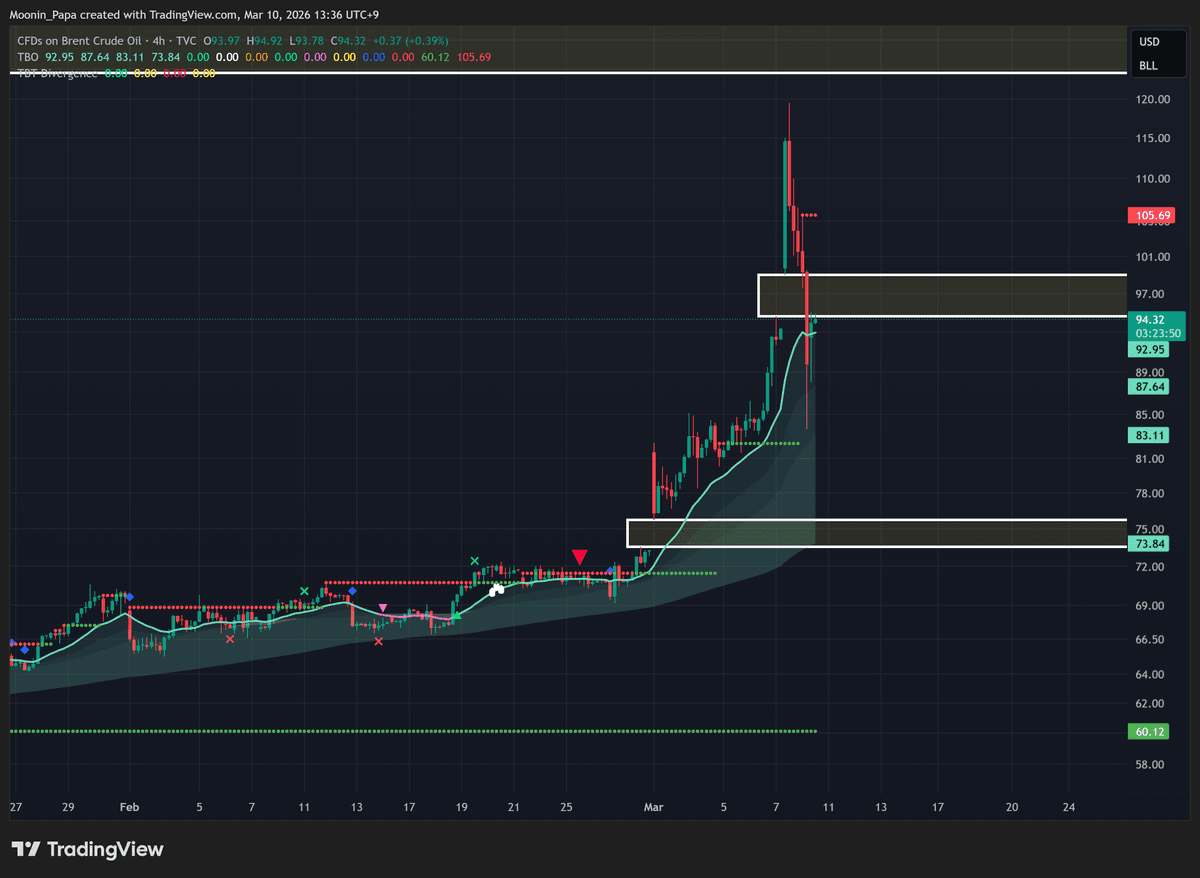
Oil volatility filled the initial gap to $94.64, with a larger gap at $73.54 still open, underscoring ongoing uncertainty in energy markets. Gold continues a gradual uptrend as investors seek safety, while silver has reclaimed its daily TBO Cloud and tests the 50% Fibonacci retracement level. Uranium closed with a TBO Close Long signal on the daily chart but must confirm before today’s close. Overall, persistent macro uncertainty supports demand for precious metals even as energy markets await clearer directional cues.
Learn my strategies and the tools I use every day by visiting The Complete Cryptocurrency Investor by Mastering Assets.
