

Bitcoin Technical Outlook
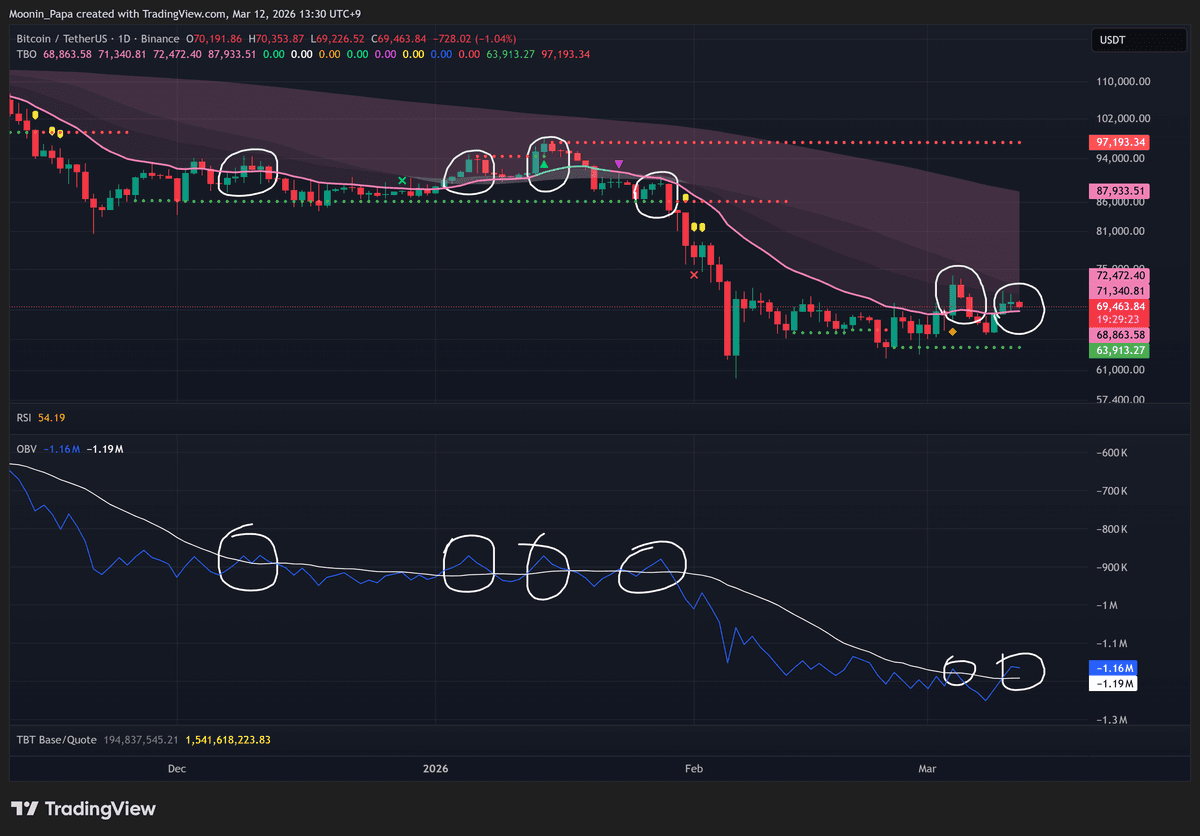
Bitcoin tested the first overhead resistance fan line again on Wednesday, but remains shy of a decisive breakout. On-Balance Volume has reliably marked pivot highs each time its white moving average line was crossed since December 2025. A flat OBV MA suggests choppy conditions. We are likely at a pivot high, yet one more push to drive RSI above 70 may be required before BTC loses support and retraces toward $49,000.
Ethereum’s pattern is similar, though its lower trading volume and social interest mute the moves. ETH may follow BTC’s lead once broader market momentum shifts.
Dominance and Market Cap Dynamics
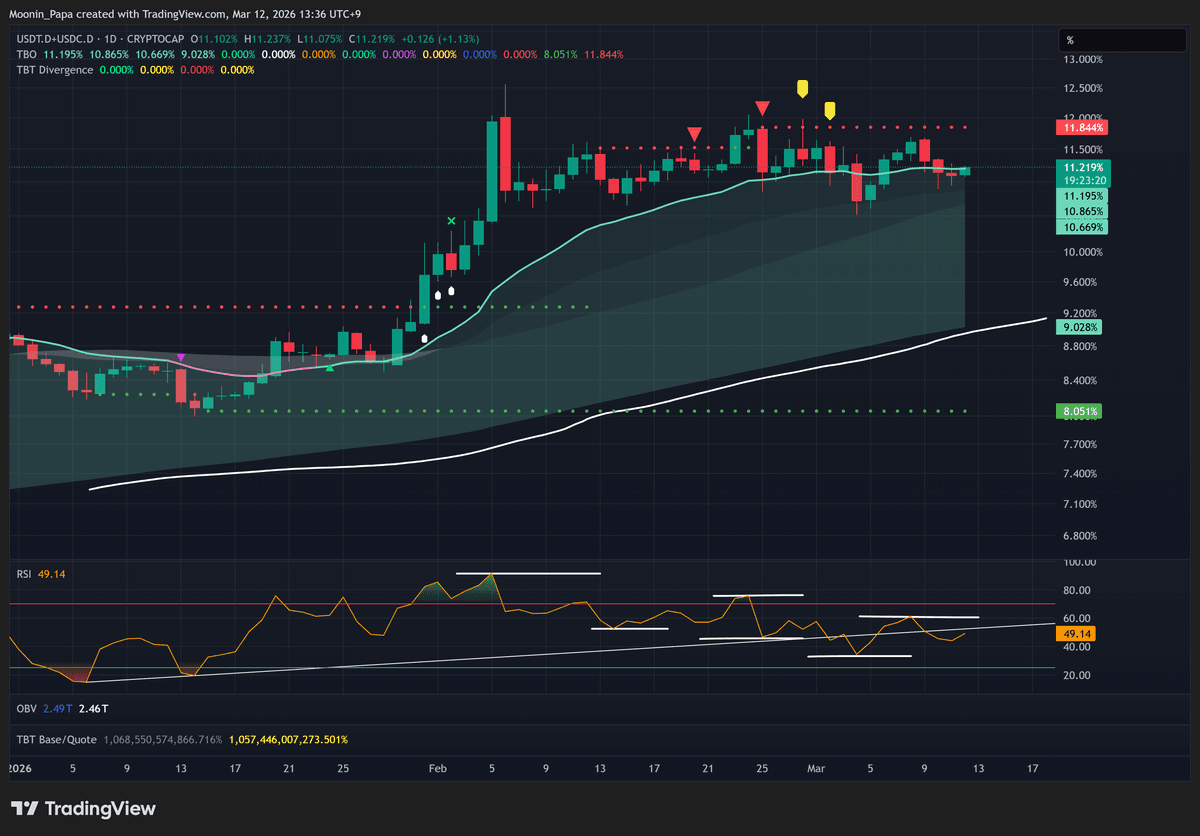
Combined stablecoin dominance remains range-bound around the daily TBO Fast line. If BTC is indeed marking a pivot high, stablecoin share should rebound toward the next resistance at 11.844%. BTC dominance (BTC.D) is churning without clear direction, while Top-10 altcoin dominance trends lower. Others.D appears set to test its daily TBO Fast support to complete a second Close Long signal.
The total crypto market cap (TOTALES) shows the same OBV reversal pattern seen four times since December, and its bear flag remains valid. Notably, TOTALES closed above its overhead resistance on Wednesday, which may temper the downside but requires confirmation in coming sessions.

Macro Influences: Currencies and Equities
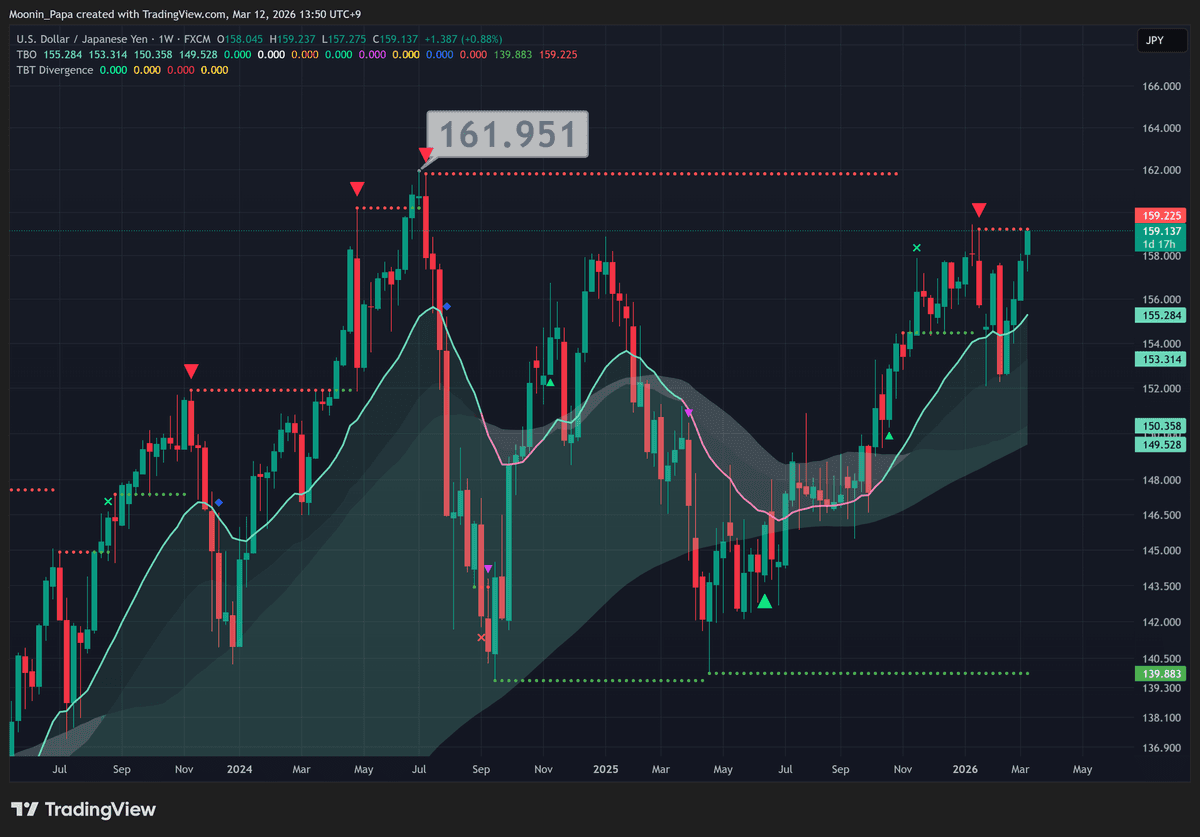
The U.S. dollar index gapped up and is pressing toward daily TBO resistance at 100.261, weighing on FX pairs including the euro and yen. USD/JPY is approaching 160; a break above risks a return to 161.95 and likely BOJ intervention to stem yen weakness. Combined with geopolitical tensions in Iran, these factors set the stage for market volatility.
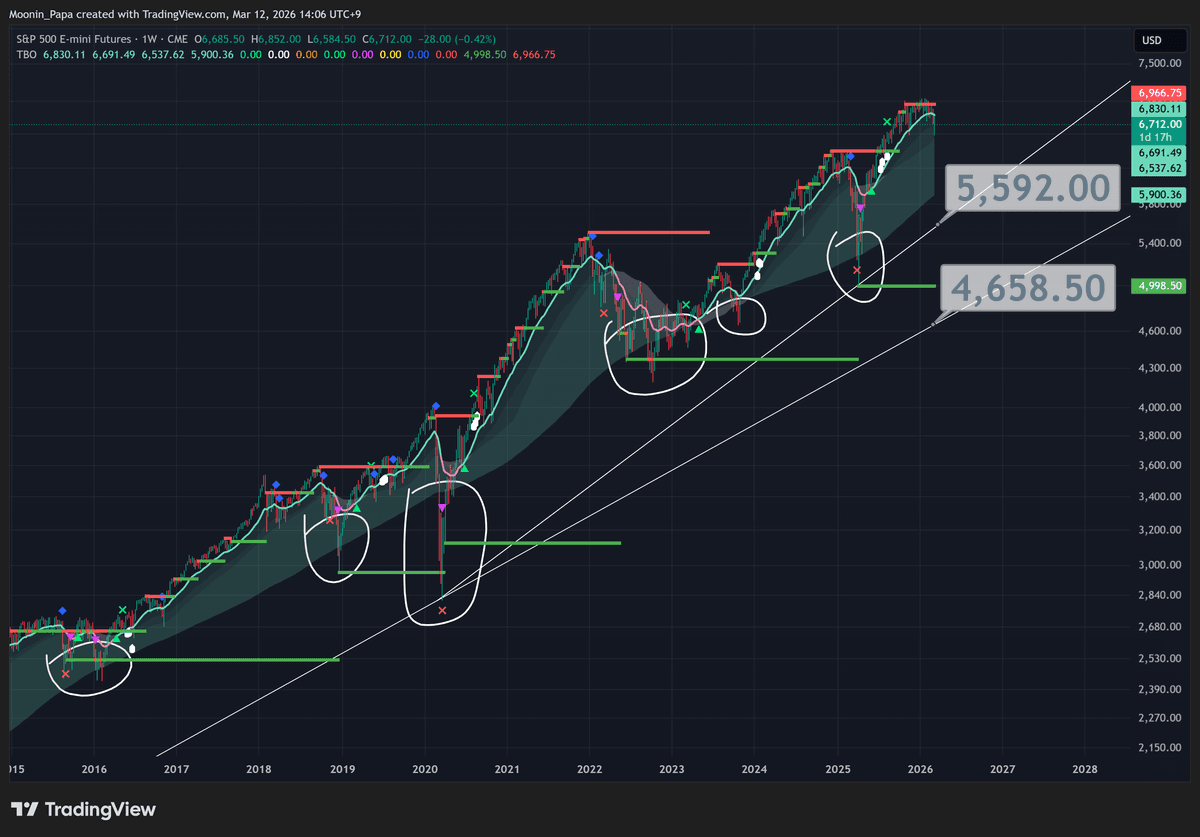
S&P 500 futures are down roughly 1% and trading below the daily TBO Cloud in strong bearish mode. Monthly support fans suggest levels near $5,592 (17% below current) and $4,658 (over 30% below). Historical precedents show major sell-offs often close just below the weekly TBO Slow line, making these targets within reach if bearish momentum accelerates.
Equities Sector Breakdown
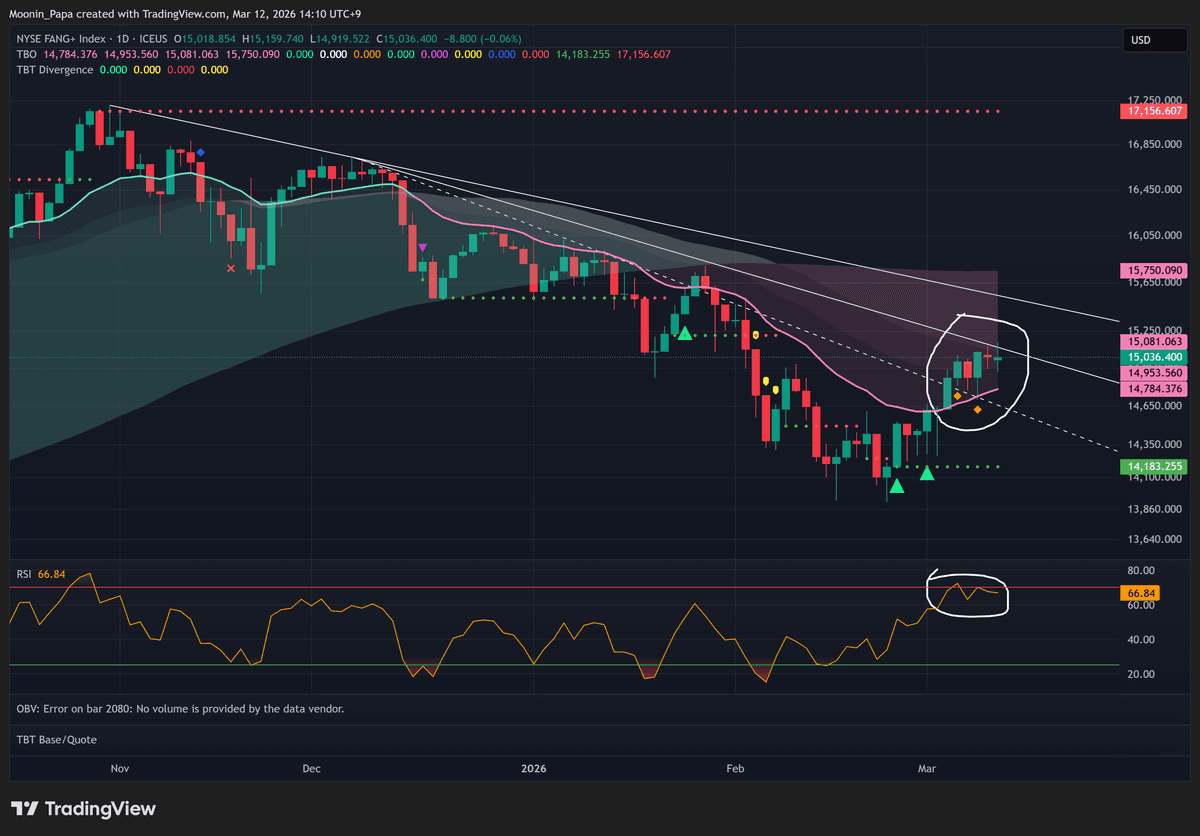
The FANG index is piercing its second resistance fan level, signaling a potential headwind if broader equities sell off. Nvidia exhibits a developing bullish divergence on its TBT indicator, yet confirmation awaits the weekly close. Should S&P futures slump, NVDA would likely dip, presenting a buying opportunity.
Tesla has cleared overhead resistance, but the VIX remains trapped in its rejection zone, indicating elevated market stress. In Asia, the Nikkei is down 2% and testing a third TBO Close Long, while the Hang Seng was rejected at its fast line. These signals underscore uneven performance and persistent risk aversion.
Commodity and Precious Metals Update
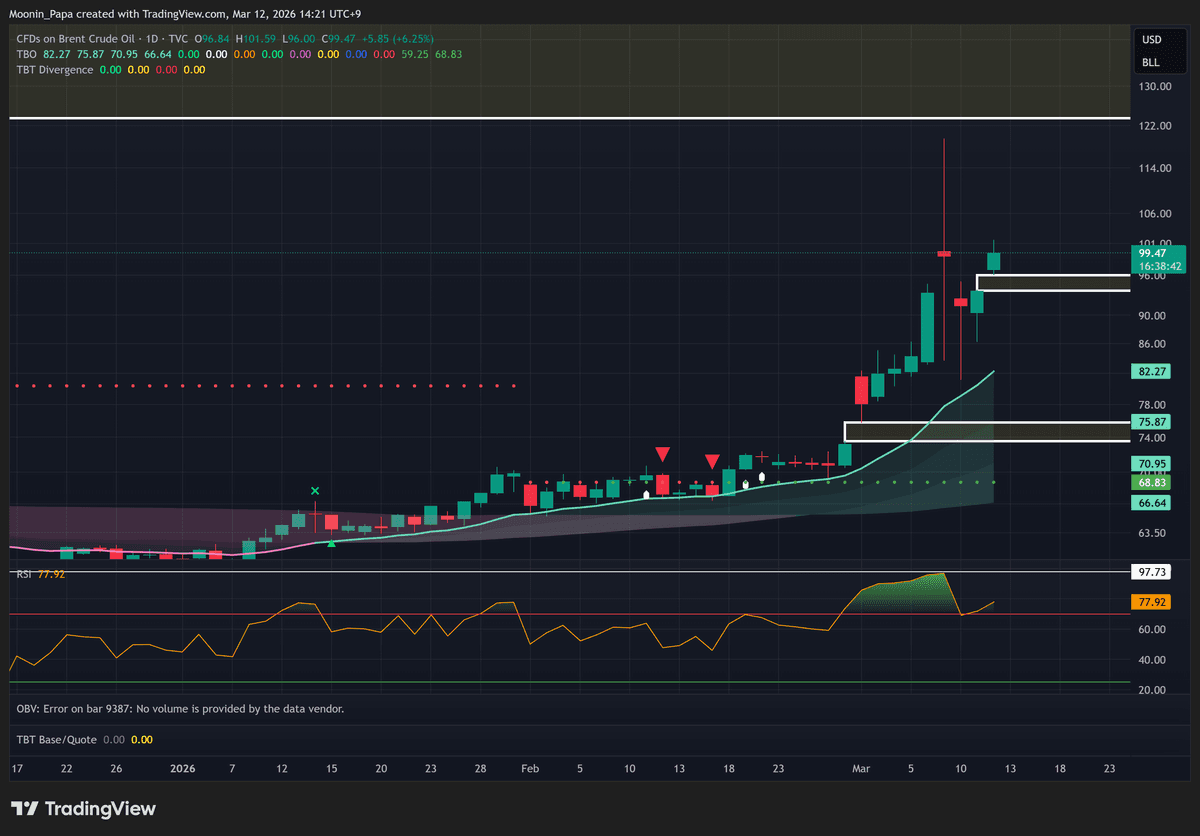
Brent crude is once again approaching $100 per barrel, a level that typically pressures risk assets. Contrarily, gold and other precious metals have yet to respond with meaningful upside, despite bearish indications elsewhere. Traders should monitor these divergences, as a breakout in metals could offer a safe-haven hedge against an equity and crypto sell-off.
Altcoin Watchlist and Risk Management
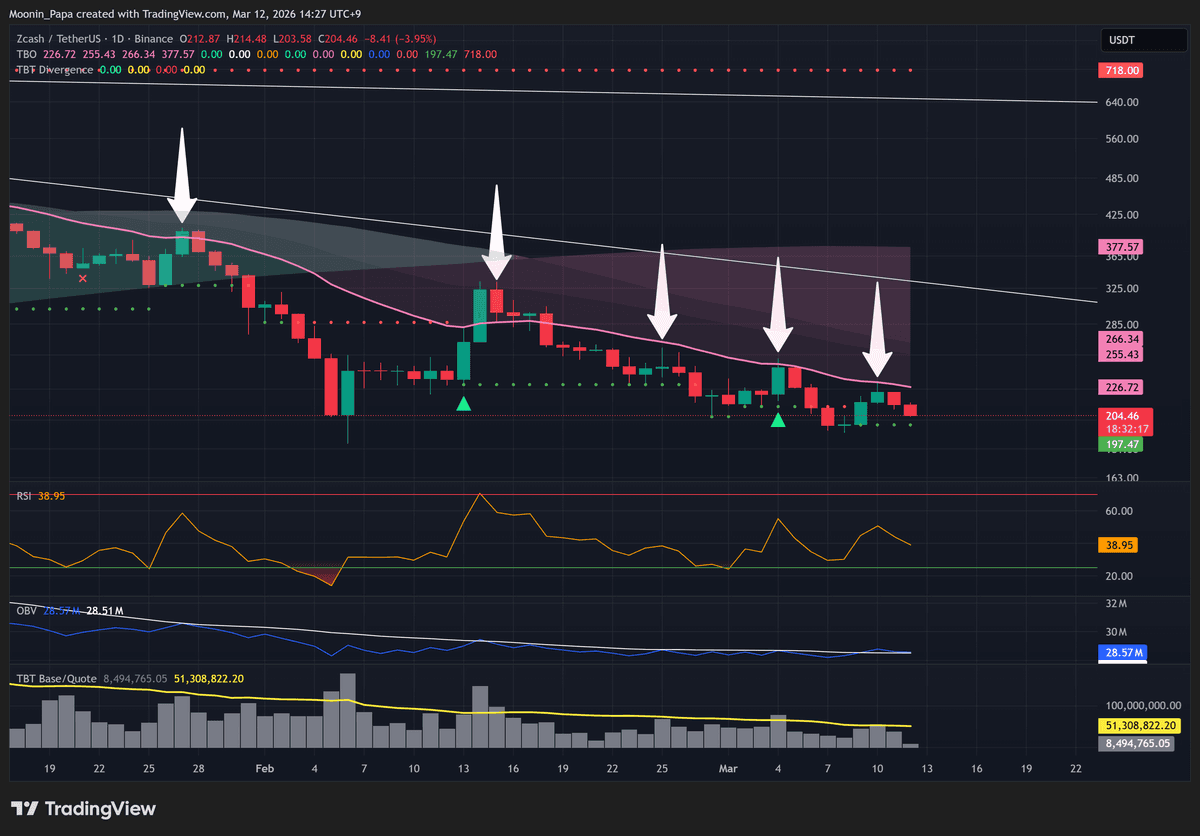
Most altcoins are exhibiting bearish setups against key TBO support and resistance lines. SOL nears its support fan, LINK targets the $8.18 TBO support, and ZEC continues to reject at its fast line. SHIB is poised for further declines, while AVAX, HBAR, ICP and CHZ show weakening momentum. A handful of names such as SKY and ASTER display short-term squeezes, but the broader trend favors downside.
Traders should consider shorting bounces to TBO resistance or placing limit bids for potential “fat-finger” dumps. Selective positioning and strict risk management remain paramount in this volatile environment.
Learn my strategies and the tools I use every day by visiting The Complete Cryptocurrency Investor by Mastering Assets.
