

Bitcoin’s Monday upper-wick pump gave traders a clean retest of the broken bear-flag support level, and the reaction was exactly what bears wanted to see: rejection. The move confirmed that the prior support area is still acting as resistance, while the daily TBO Fast line also marked the rejection zone.
The broader message from today’s market read is that crypto risk remains fragile. Bitcoin and Ethereum are still showing strong-bearish characteristics, dominance charts continue to warn about downside pressure for ALTs, and macro volatility is building around the U.S. dollar and USDJPY.
Bitcoin confirms the bear-flag rejection

Bitcoin’s bear-flag support was tested successfully on Monday’s upper wick pump, and price rejected from that area. That confirms the bear flag is still in play. The chart now has a lower target around $46,870, which is even below the next artificial support target near $49,000.
Other indicators did not invalidate the bearish view. Bitcoin remains strong bearish, OBV and the TBO remain bearish, volume was weak, and RSI stayed neutral around 50. In short, the bounce gave another short-entry area rather than a trend reversal.
Ethereum remains strong bearish
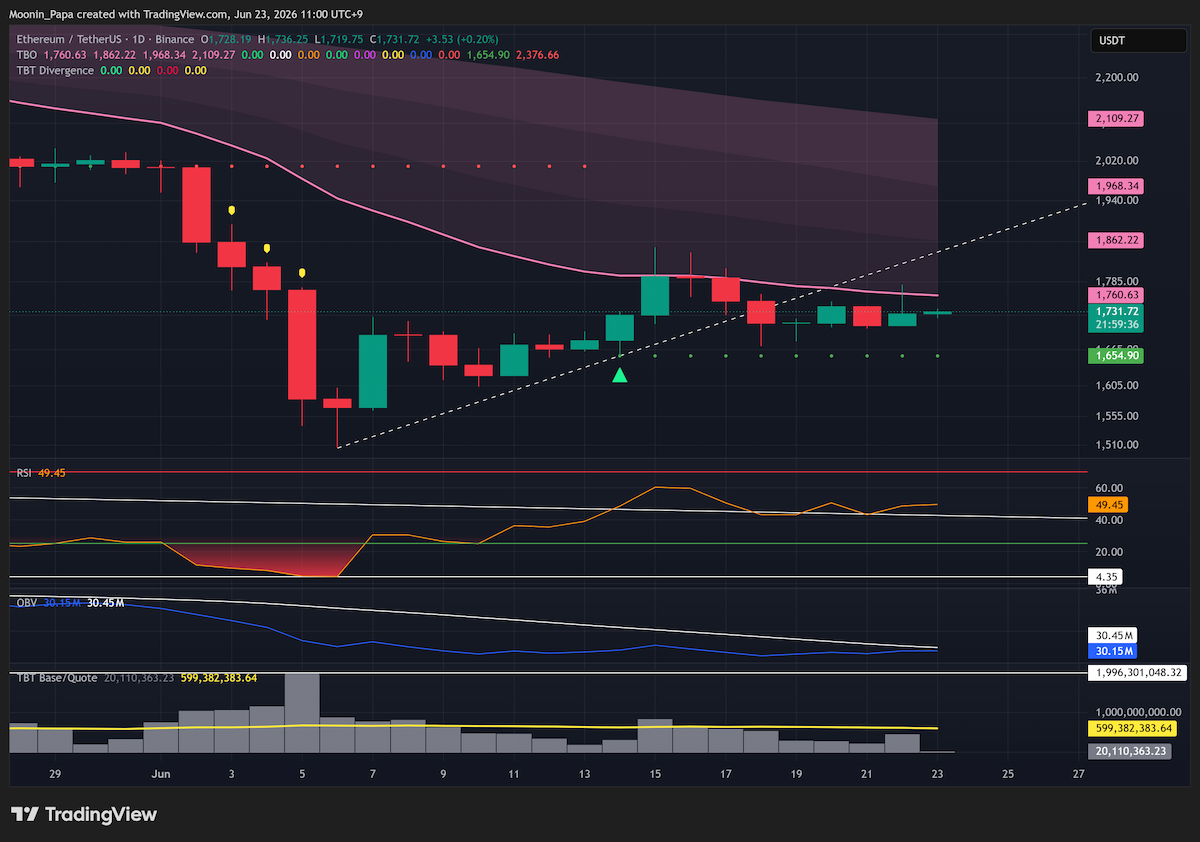
Ethereum did not form a fresh bear flag, but it did not improve either. Monday’s upper wick hit the TBO Fast line without reaching or reclaiming previously lost short-term support. Volume was also weak, so the daily ETH read remains strong bearish.
This matters because ETH weakness adds confirmation to the broader crypto risk-off setup. If Bitcoin continues to reject from broken support and Ethereum cannot reclaim its own support levels, ALT risk stays elevated.
Dominance charts keep the ALT-dump thesis alive
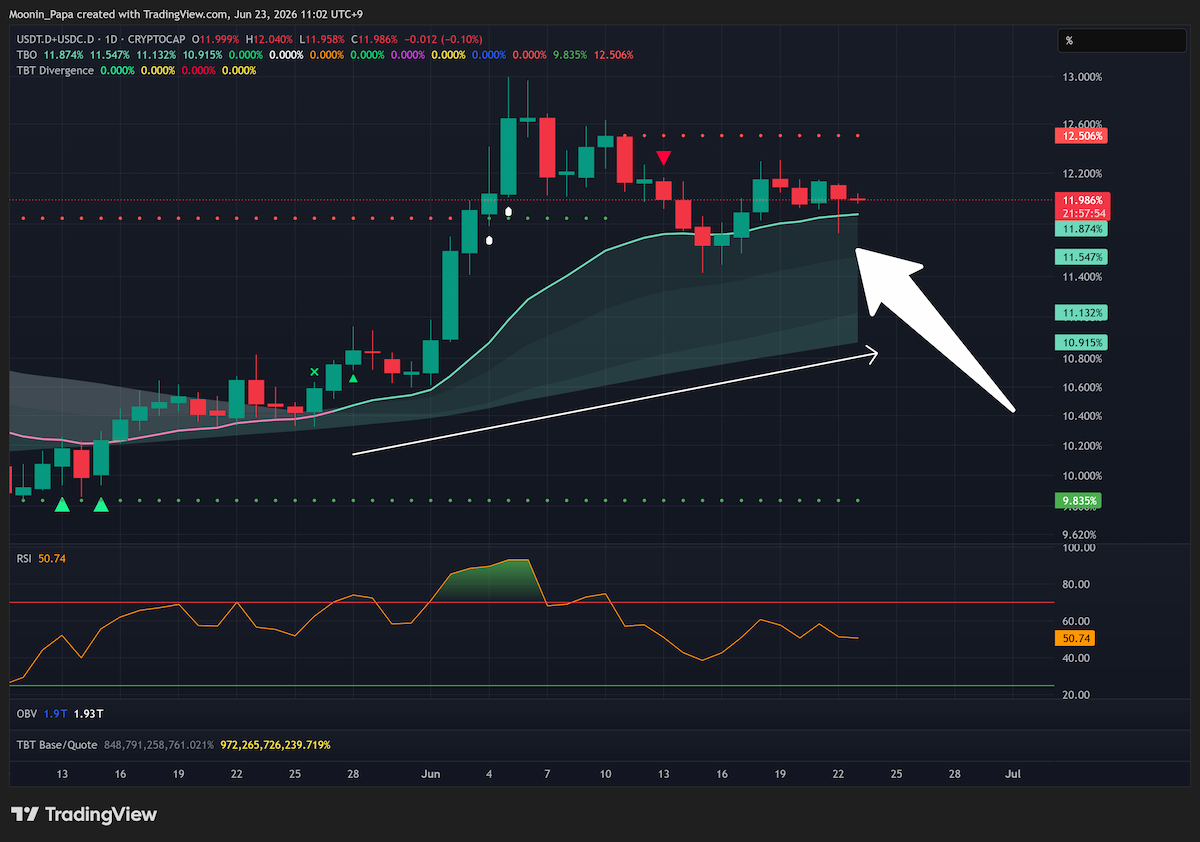
Combined stablecoin dominance remains macro bullish because the Slow line is still pointing higher, but Monday’s volatile move in BTC and ETH created a lower wick back into the TBO Cloud. That weakens the uptrend and hints at a possible short-term drop or collapse inside the Cloud.
The key line remains TBO Resistance at 12.506%. Until combined stablecoin dominance closes above that level, the chart is not fully back in the safe zone. Meanwhile BTC.D wicked into the Fast line/TBO Cloud, OTHERS.D dropped lower inside its Cloud, and OTHERS/BTC closed inside the daily Cloud, pivoting from strong bullish to bearish consolidation.

USDJPY is the macro pressure point
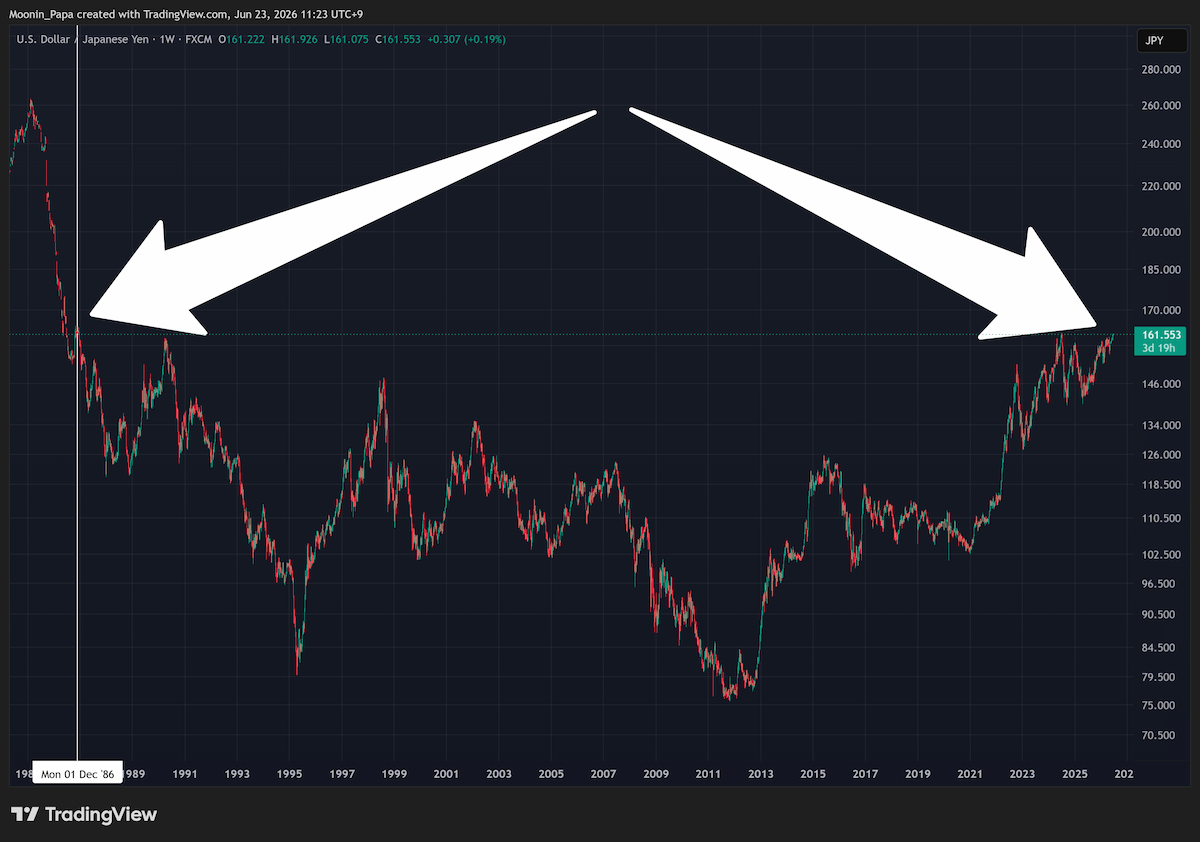
The macro story is getting louder. DXY is pushing 101 and looks short-term overbought, while EURUSD is short-term oversold. The bigger development is USDJPY, which made a new local high at 161.926 and moved within 0.025 of the July 2024 high at 161.951.
USDJPY is also working on a second weekly TBO Breakout with RSI above 70. The yen is near levels last seen in 1986, and the Bank of Japan intervention risk is now front and center. If USDJPY sees irregular volatility, Japan-linked risk assets such as the Nikkei could feel the consequences.
U.S. indices are not strongly bearish, but risk is rising
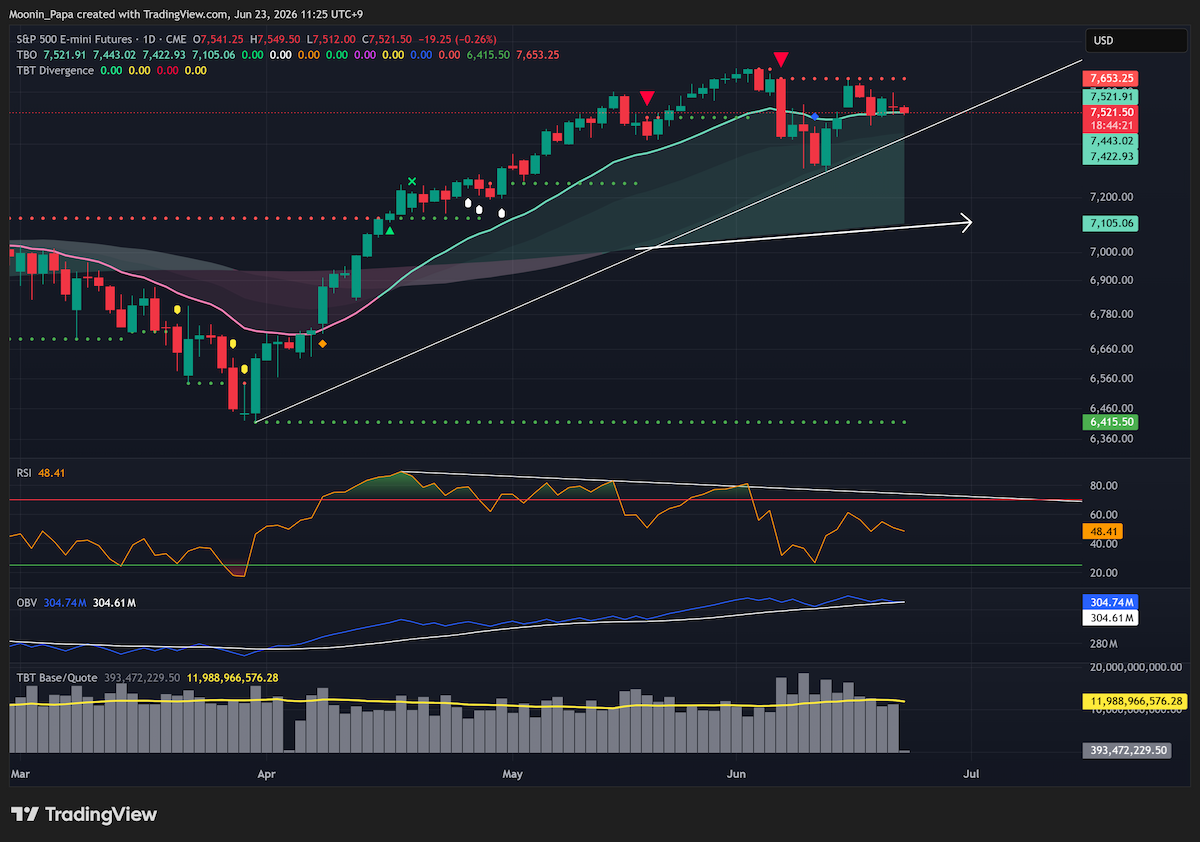
S&P futures are threatening another drop inside the daily TBO Cloud, which would mark another pivot toward bearish consolidation. RSI has been putting in lower highs and lower lows, and a bullish RSI Reset has not appeared yet.
That said, the broader U.S. index setup is more nuanced than crypto. SPX, DJI, NDX, and NVDA are chopping rather than clearly strong bearish. VIX remains strong bearish, while SPCX’s sharp Monday drop adds a potential euphoria/top-signal narrative after a heavily hyped IPO.
ALTs show scattered tactical signals inside a bearish backdrop
The ALT section remains mixed but mostly defensive. XRP, BNB, SOL, TRX, and several majors remain bearish or in bearish consolidation. HYPE almost tagged its daily TBO Fast line but still has room for a deeper Cloud test near the white ascending support line around $55.
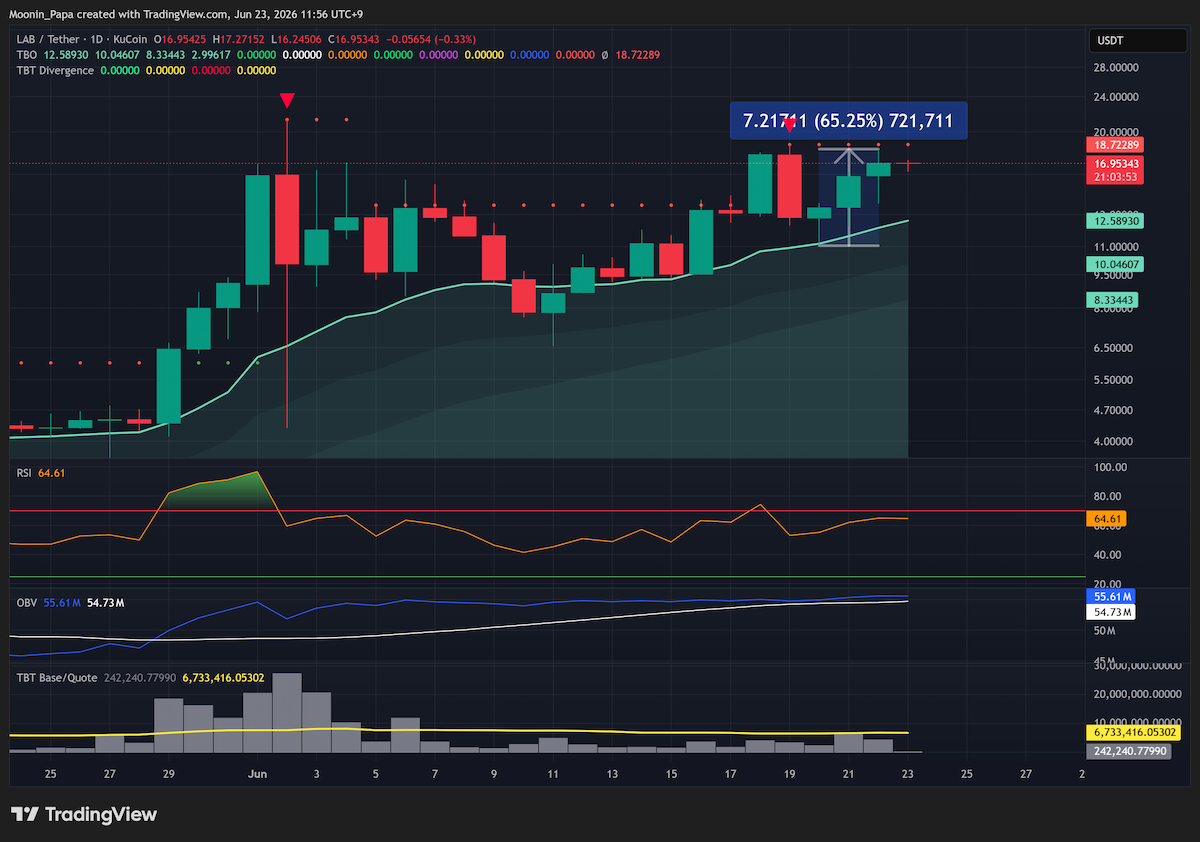
There are tactical standouts, though. WLD is flashing a 4h bearish reversal warning, DEXE is up more than 20%, AERO still looks strong bullish, H dumped 33%, and LAB printed a TBO Springboard Bounce from Saturday to Monday that produced a 65% move.
Interested in learning how to read market structure with the same indicators Aaron uses in these reports? Learn more at Mastering Assets.