

A broad pullback is testing whether the current crypto trend can reset and extend. Bitcoin is approaching a level that would close an earlier reversal signal, Ethereum remains comparatively stronger, and selected dominance charts are building bounce setups. At the same time, weakness in global equities, commodities, and several altcoins argues for tighter risk control in the latter half of July.
Bitcoin approaches a constructive reset level
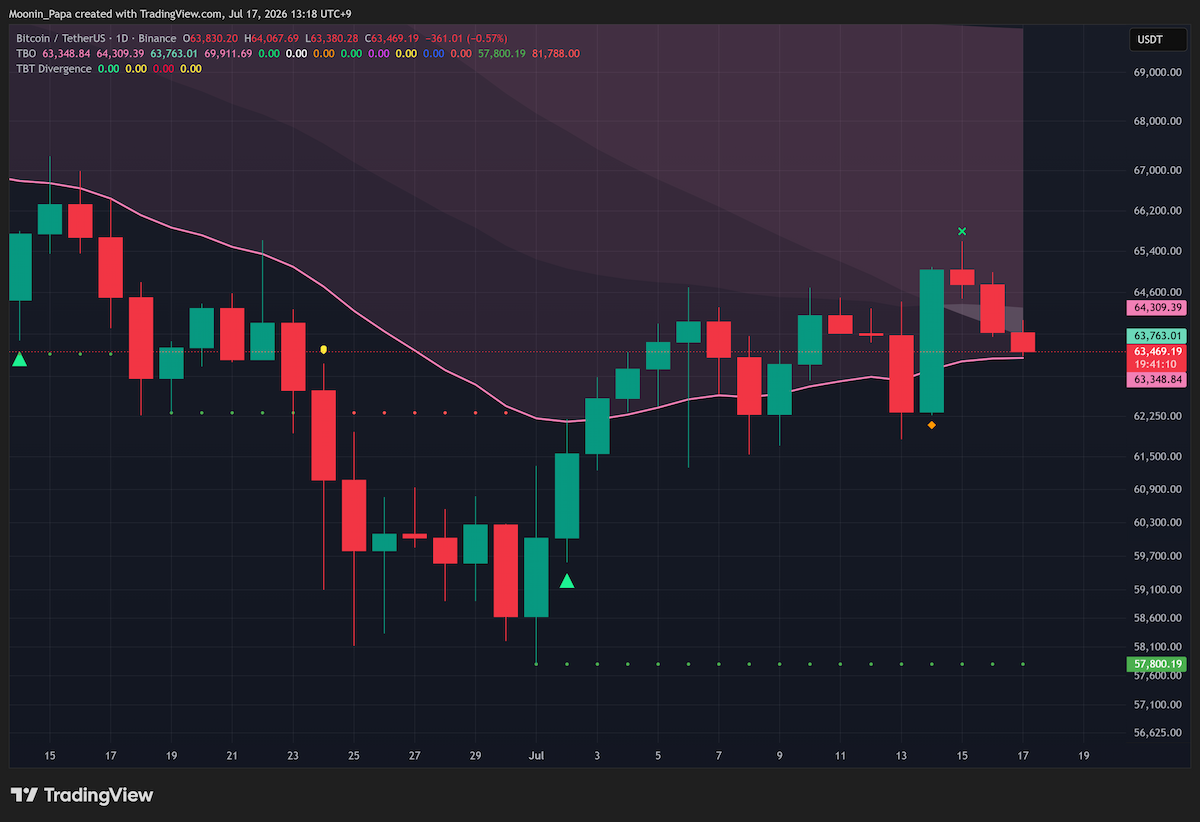
Bitcoin daily chart approaching the TBO Fast line
Bitcoin was approximately $100 from its daily TBO Fast line. A tag would close the TBO Close Short from Tuesday and create a potential re-entry opportunity. The pullback also pushed OBV below its white moving-average line on Thursday, which is a setback, although that moving average is still pointing upward and supports the source analysis's buy-the-dip interpretation.
That constructive framing does not eliminate risk. July has been positive as expected in the source, but August is historically weaker, making stop losses appropriate for protecting profits and limiting losses.
Ethereum remains stronger while its exit signal matures
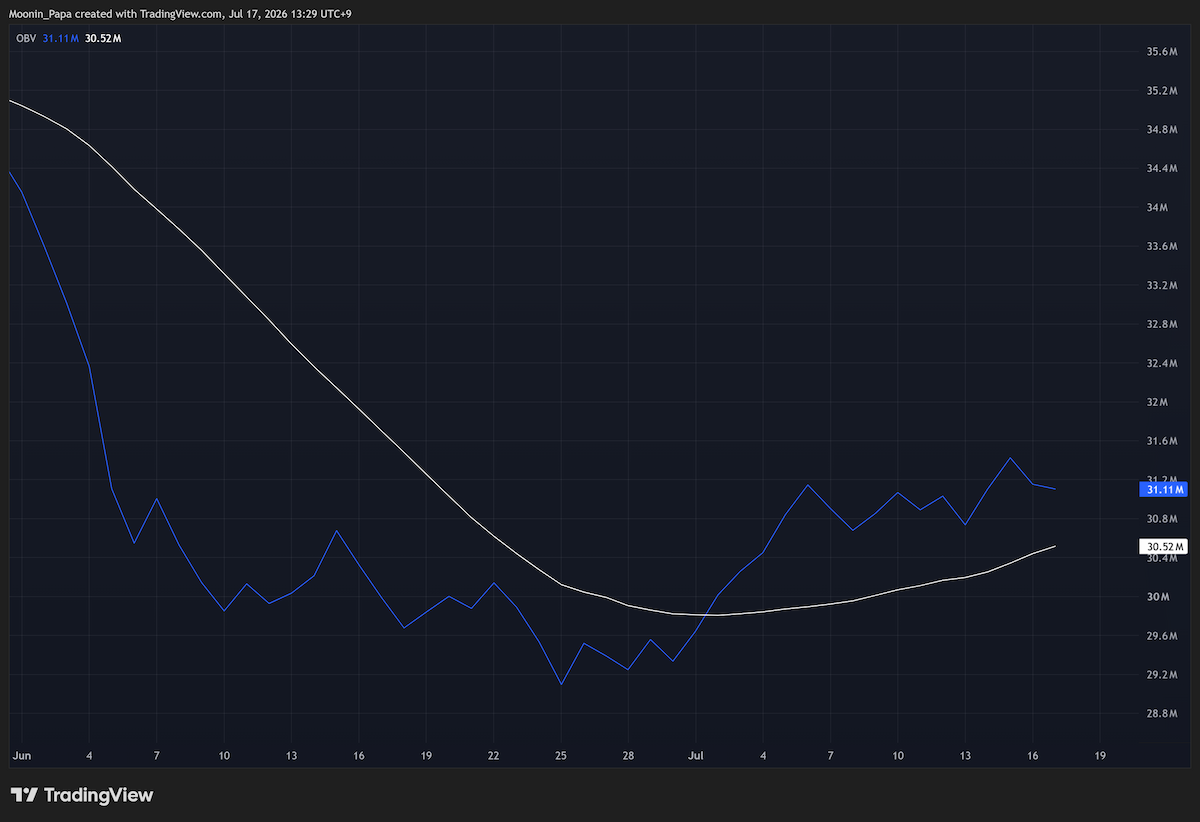
Ethereum daily OBV chart showing a strongly bullish moving average
Ethereum also has an open TBO Close Short, but its trend structure remains stronger than Bitcoin's. ETH's OBV moving-average line is still strongly bullish, and the blue OBV line is not close to crossing below it. A pullback to the daily Fast line would damage the trend, but current relative strength remains intact.
Ethereum dominance, or ETH.D, supplied the more urgent signal. After moving above the Cloud, RSI reached a very overbought 89.04 before the chart pulled back. The source identifies this as the awaited exit opportunity for longs and a possible short-entry zone, while still allowing for ETH to push closer to $2,000 first.

Dominance charts preserve bullish bounce capacity
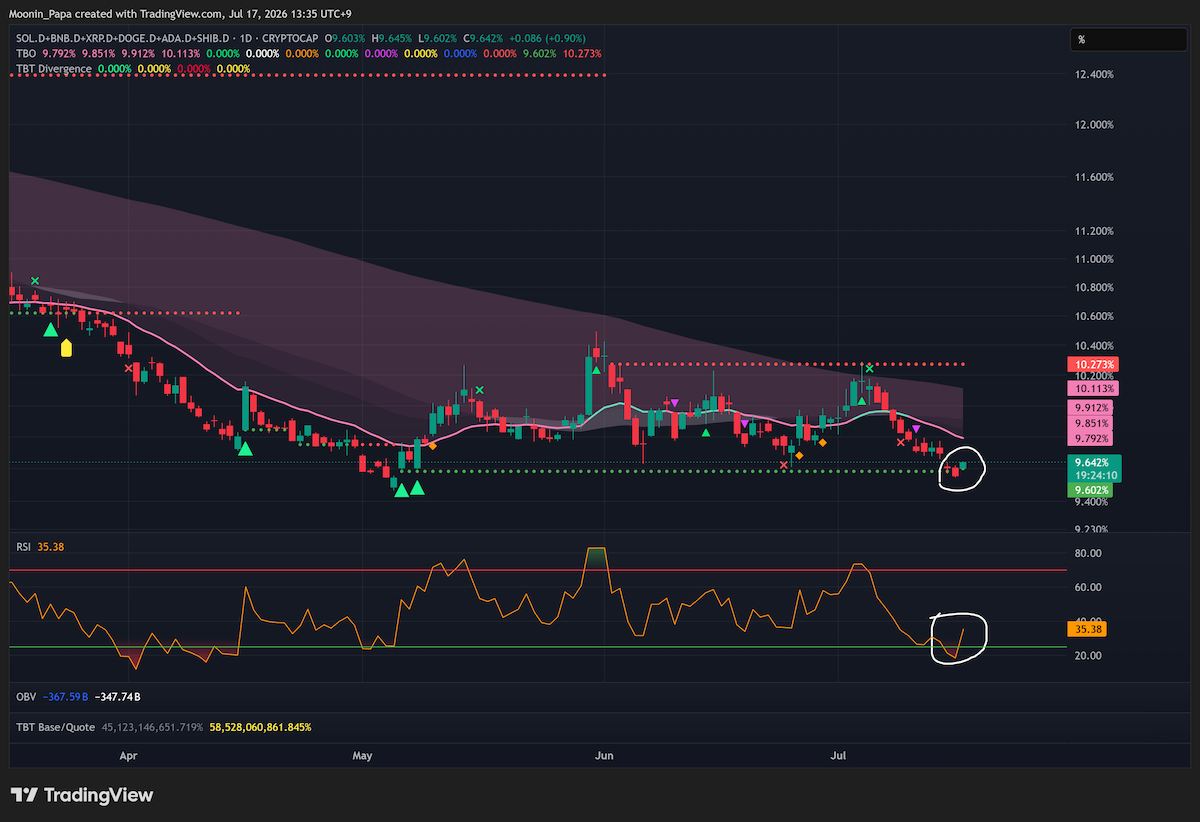
Top 10 Dominance chart with a bullish reversal setup
Top 10 Dominance is printing a strong bullish reversal setup, including a significant bullish RSI Reset and a bounce from TBO Support. OTHERS.D is also working on a second bullish RSI Reset after confirming an Open Short on Thursday. Together, these charts preserve bounce capacity, but the latter half of July calls for caution.
SOL.D requires precise interpretation: it measures Solana dominance and is not the SOL spot-price chart. RSI almost reached oversold territory on Thursday, but the expected dominance bounce did not occur. The source anticipates some improvement if Bitcoin bounces, not a specific SOL price move.
Global equities shift into a sharper risk-off phase
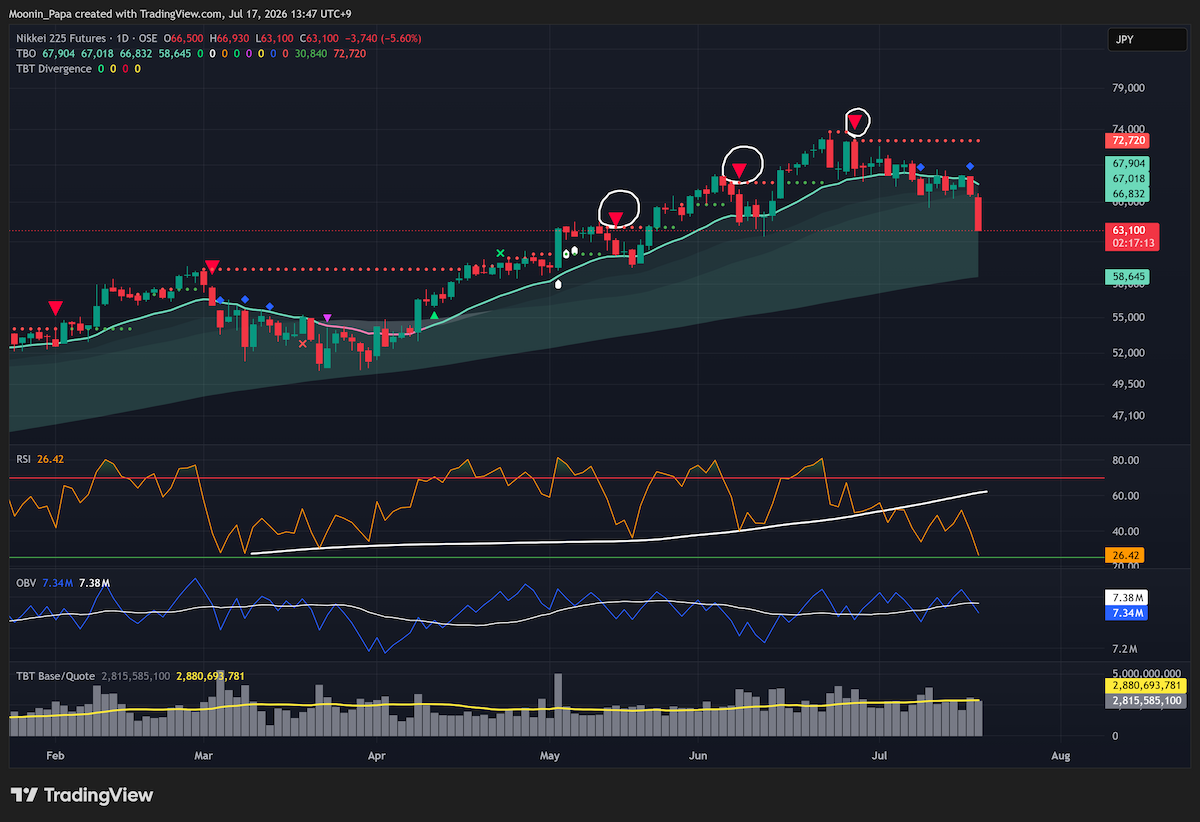
Nikkei daily chart during a decline of more than five percent
S&P futures were down 0.74%, NDX moved deeper into its Cloud, and after-hours weakness spread to major technology names. The Nikkei produced the clearest global warning, falling more than 5% on the day and more than 8% for the week while tagging its weekly Fast line for the first time since the April 2026 bounce.
The macro TBO Slow line remains bullish, which can ultimately support a buy-the-dip opportunity. However, the source favors waiting for RSI and price to establish a bottom rather than trying to catch a falling knife.
Oil and metals confirm weak commodity momentum
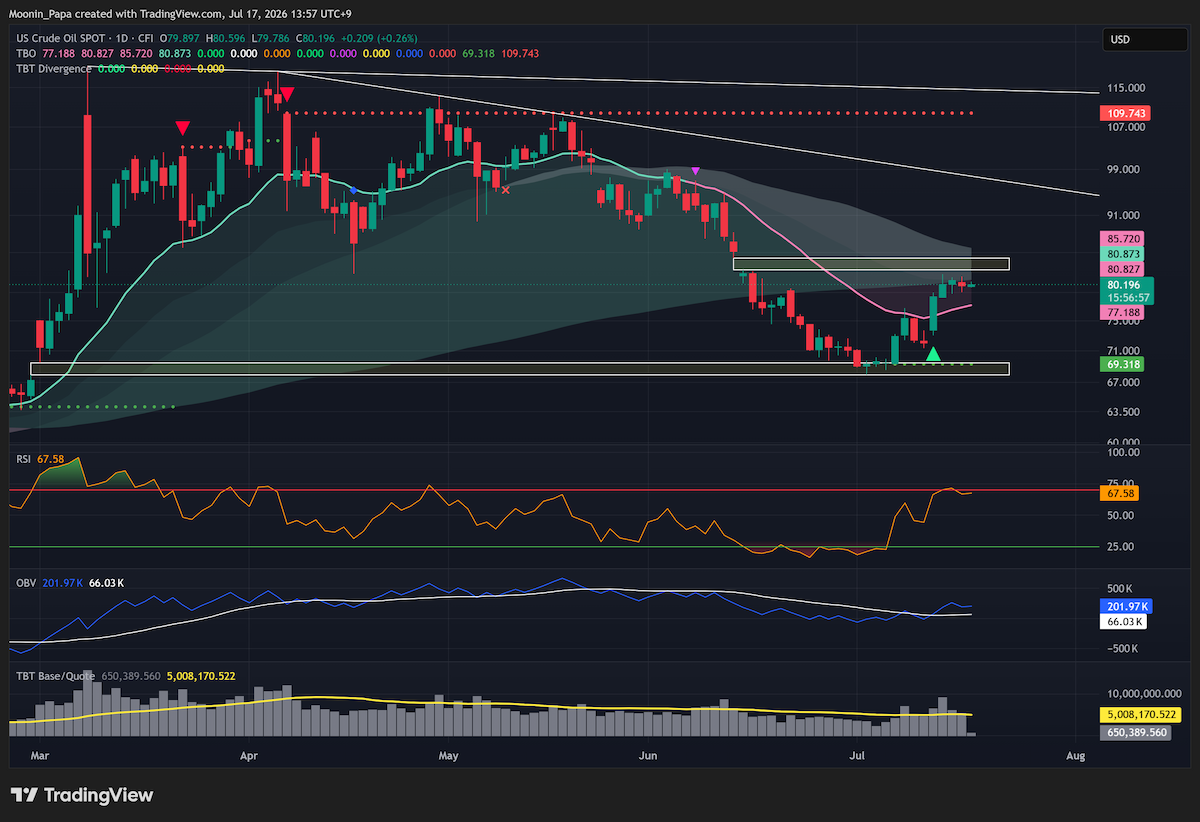
WTI daily chart showing a risky short setup
WTI is weakening despite headlines that might normally be expected to support oil. The Better Traders Bot also identified Oil, WTI, or CL as a short setup on consecutive days. The source is short oil but explicitly describes the trade as risky, so the signal is a tactical setup rather than a certainty.
Gold remains strongly bearish with no bullish momentum change. Silver printed a TBO Breakdown and is working on another near the historical 54.48 pivot, while uranium fell 5% on Thursday and printed a second TBO Breakdown without yet reaching oversold RSI.
Altcoin dispersion rewards selectivity
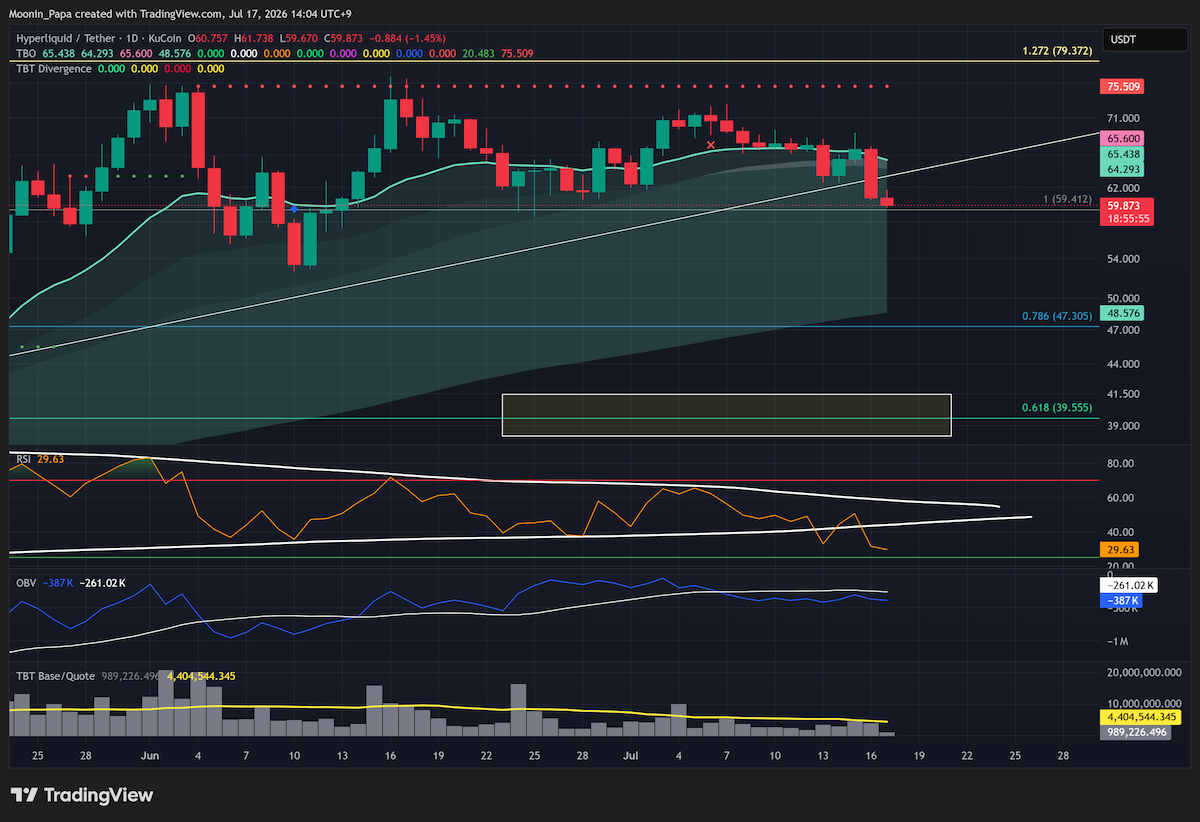
HYPE daily chart after a decline of more than nine percent
HYPE fell more than 9% on Thursday, continued lower, and closed below long-term support. The next cited objective is the 0.618 Fibonacci retracement just below $40. Other warnings include bearish divergence risk in ZEC and LDO, four TBO Close Longs in BEAT since Wednesday, and a TBT Bearish Divergence in AAVE.
The board is not uniformly bearish. XMR has a convincing but incomplete four-hour TBO Breakout setup, MNT printed a TBT Bullish Divergence, and DOT printed its first bullish divergence cluster since July 8, 2025, although its longer trend remains strongly bearish.
Learn my strategies and the tools I use every day by visiting The Complete Cryptocurrency Investor by Mastering Assets.
