

Bitcoin recovered into its daily Cloud after a Monday wick to $62,300, but the crypto structure remains conditional and the analysis still favors another oscillation toward lower support unless BTC clears short-term resistance. At the same time, a sharp rise in PMI to 55.6 materially improved the outlook for US equities without erasing the weak signals across crypto breadth and selected global markets.
Bitcoin recovered into the Cloud, but resistance still decides the next move
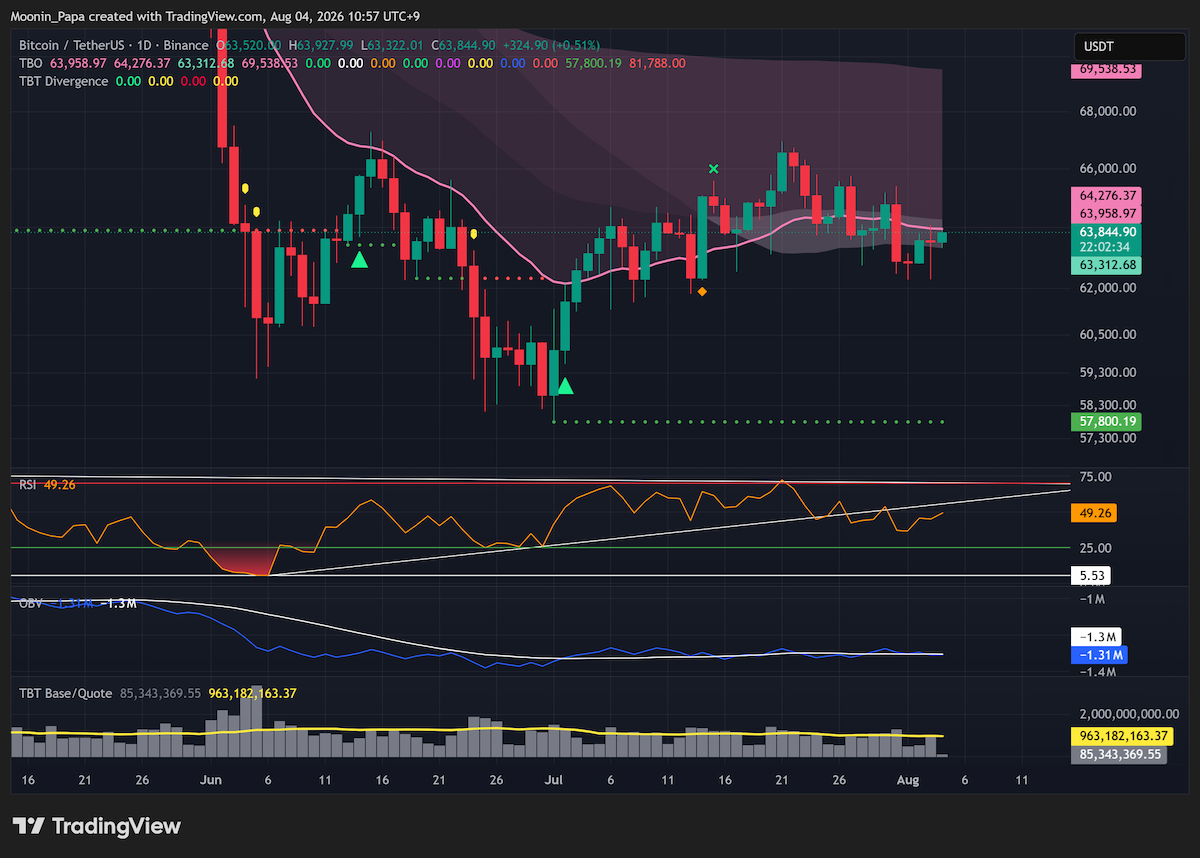
BTC wicked to $62,300 on Monday, nearly undercutting Saturday’s low, before recovering inside the daily Cloud and tagging the Fast line. That retrace is constructive, but RSI remains below resistance and OBV is flattening and beginning to trend lower. The analysis continues to favor the existing oscillation toward the next support-step zone below $62,000 unless BTC closes above short-term overhead resistance, which would require a close above roughly $64,000.
Ethereum is showing a cluster of bearish warnings
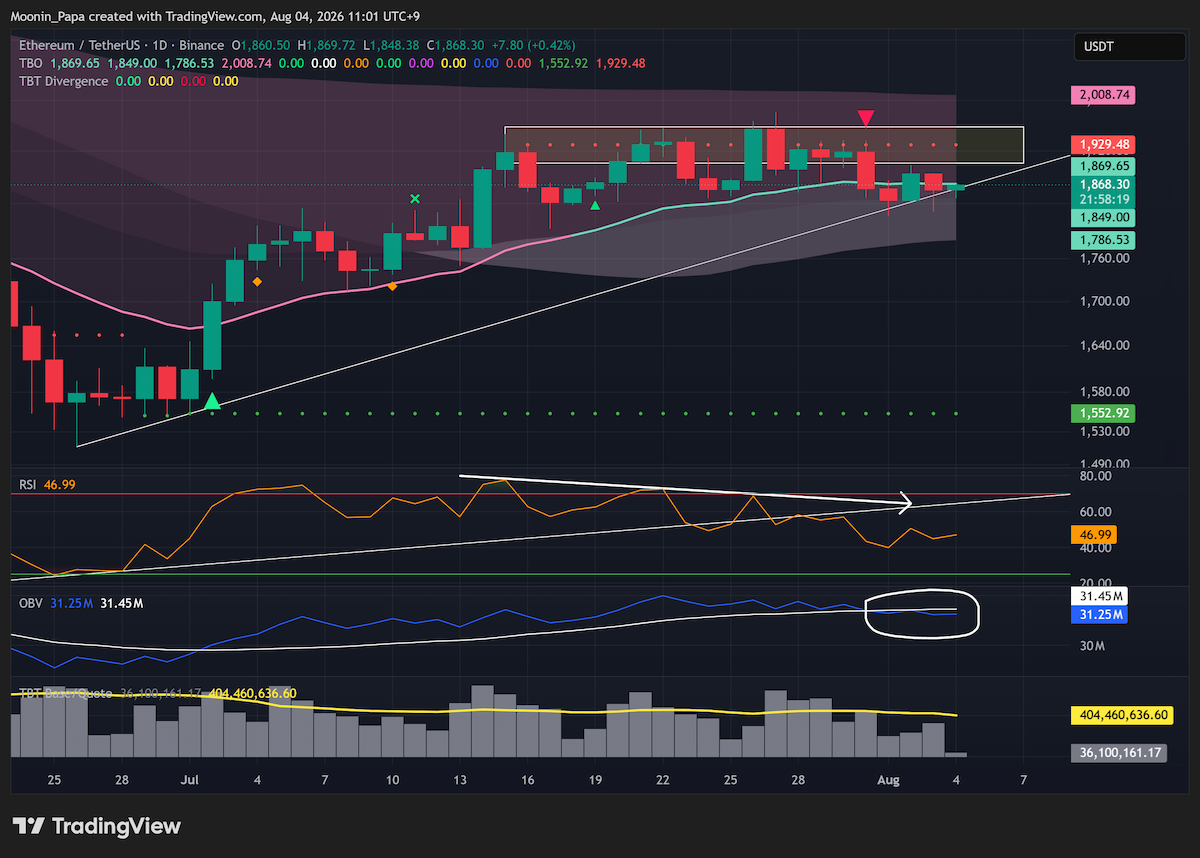
ETH printed a TBT Bearish Divergence on Friday, dipped below the Fast line, and then wicked twice into short-term support. A close below that level could open a move toward the bottom of the Cloud, but that outcome still requires confirmation. RSI leans bearish and OBV crossed below its white moving average over the weekend. ETH/BTC added a second TBT Bearish Divergence on Monday, reinforcing the warning without turning it into a guaranteed breakdown.
Stablecoin dominance has not delivered its closing confirmation
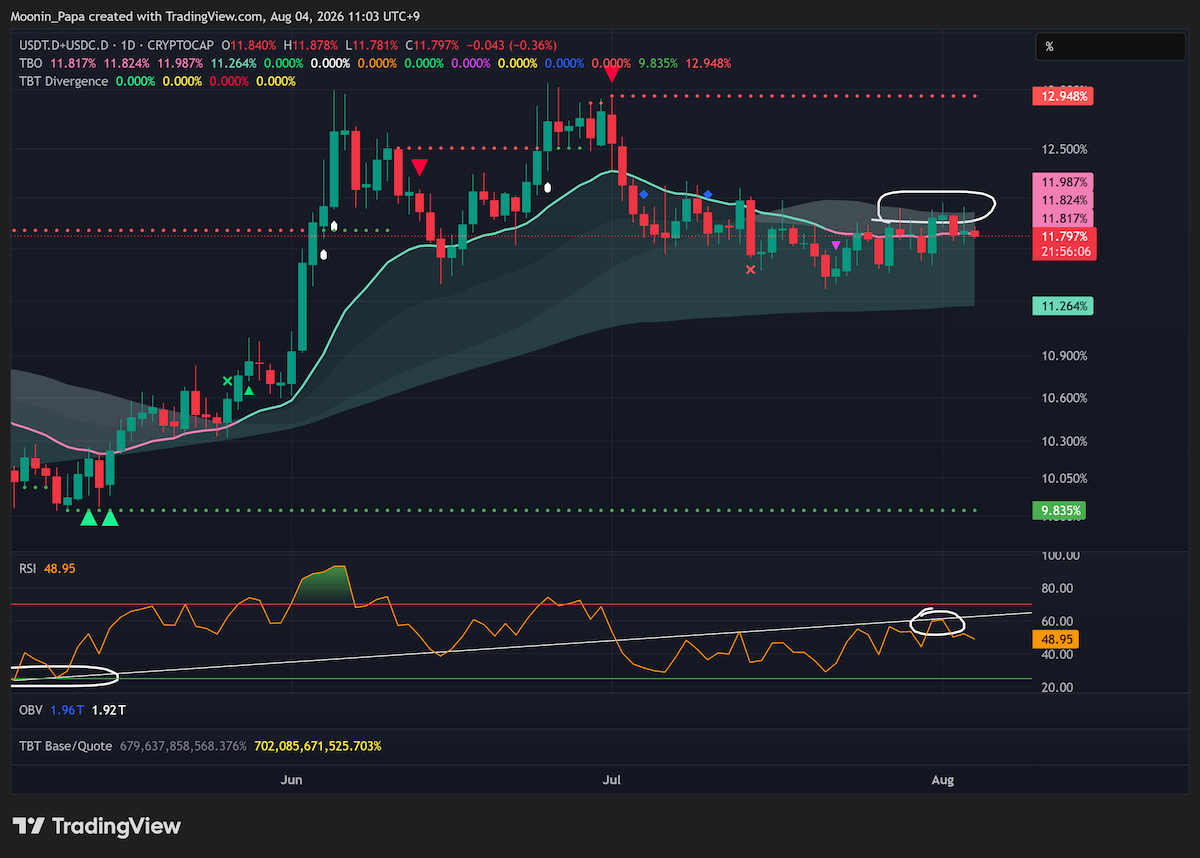
Combined stablecoin dominance again wicked above the daily Cloud on Monday but has not closed above it. That close matters because a confirmed move above the Cloud could precede a TBO Open Long, similar to the setup seen before the June decline. Elsewhere, BTC dominance remains in consolidation, ETH dominance printed another bearish divergence, OTHERS.D remains strong bearish, and RSI and OBV across the broader market-cap charts remain weak.

The new PMI reading changes the US equity outlook
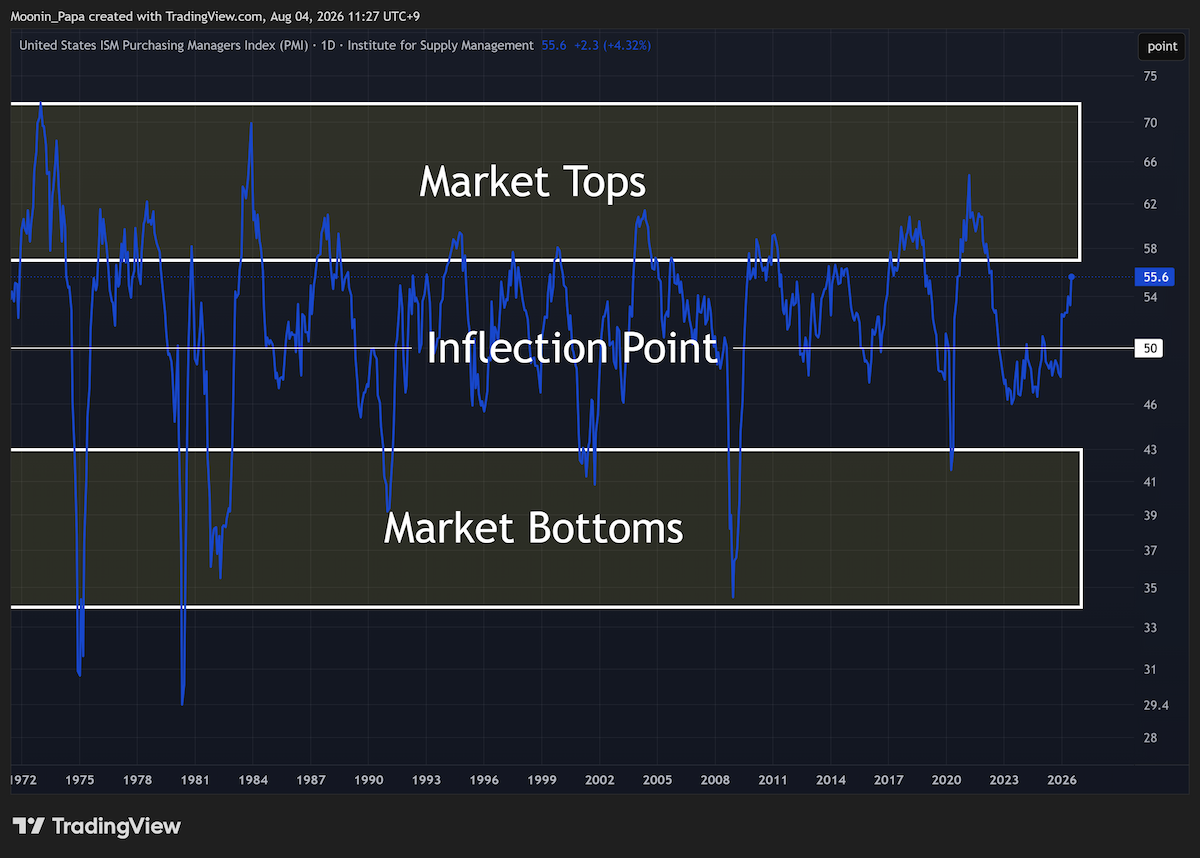
US ISM PMI jumped to 55.6, up 2.3 points and its highest reading since June 2022. The chart is moving toward an area associated with past market tops, and the current move represents a major improvement for US equities. That does not imply an immediate market top, nor does it guarantee that every market will rise. It does, however, represent a material change from the previous US stock outlook.
US indexes are responding positively, but the strength is not universal
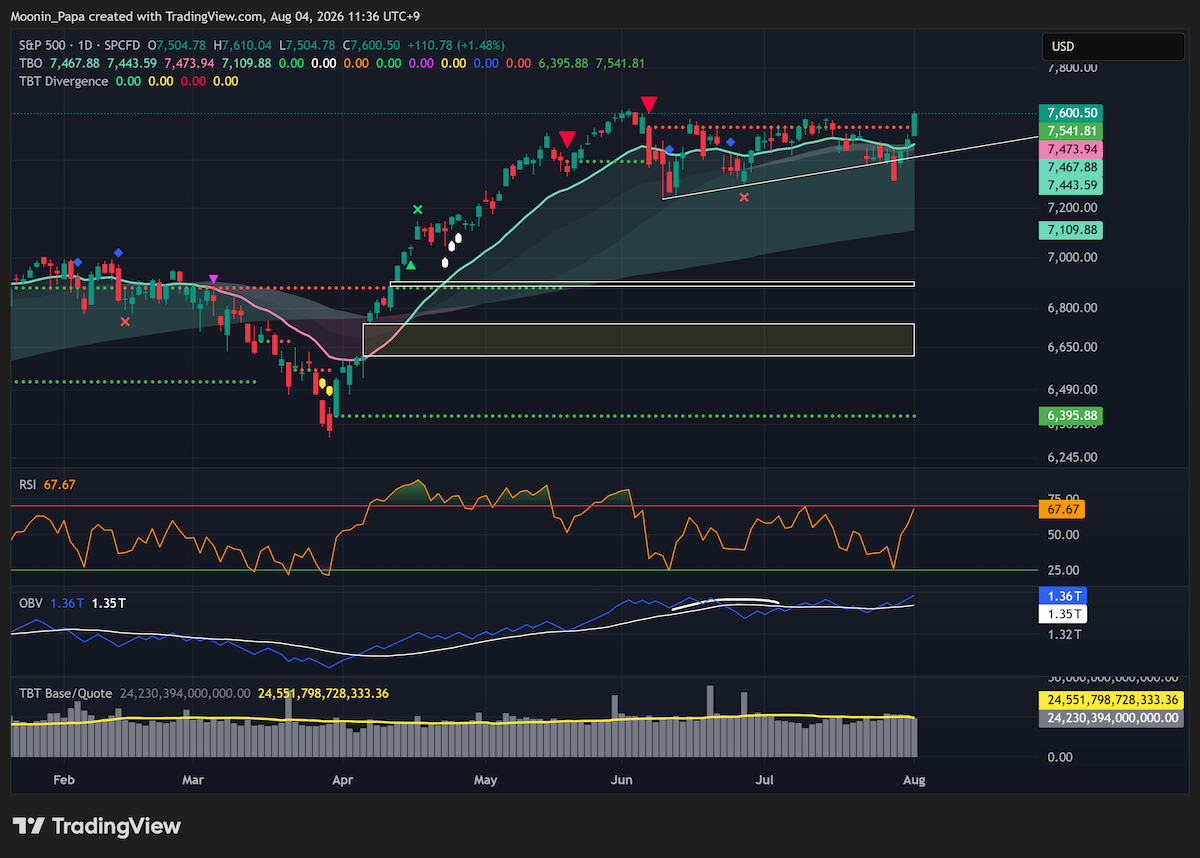
S&P futures pushed back toward TBO Resistance and the SPX spot chart was described as being close to a new all-time high. DJI was nearly there, NDX still had an upper gap to close, NVDA had not closed its lower gap, and TSLA was framed for a recovery toward its upper gap and potentially $400 if the broader market continues higher. The PMI data applies to US indices and should not be projected automatically onto Japan, Hong Kong, Korea, or every other market.
ALT setups remain selective and conditional
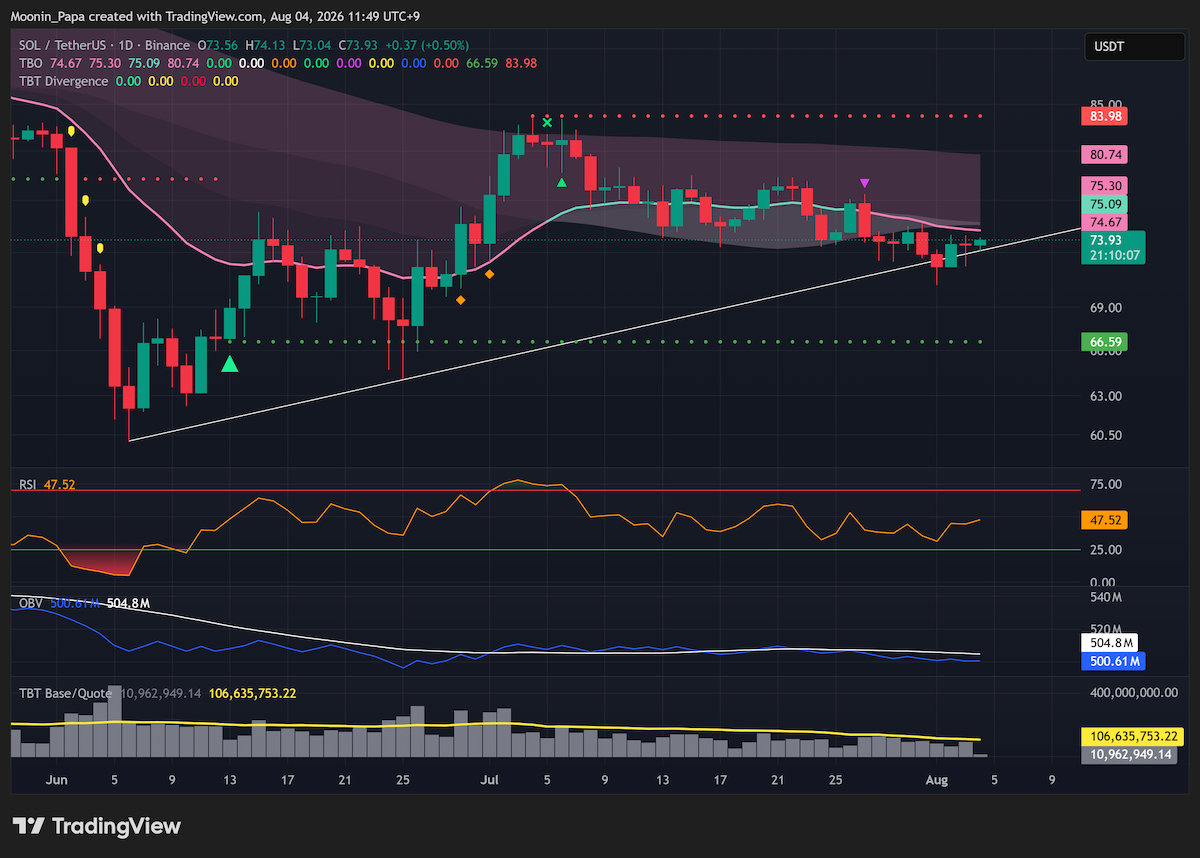
SOL is holding support only “kinda-sorta”; a confirmed close below support could open a larger move lower. ADA’s elevated RSI and recent four-hour TBO Breakout Cluster look more like exhaustion than continuation. UNI remains a conditional Springboard Bounce candidate as long as there is no massive pullback, while NEAR, ICP, ATOM and ENA are being watched for resistance or Fast-line short setups. Those are chart conditions to monitor, not unconditional trade outcomes.
Learn my strategies and the tools I use every day by visiting The Complete Cryptocurrency Investor by Mastering Assets.
