

Gold futures suffered their second $120+ single-session decline in just the last 6 days on Tuesday, with COMEX December contracts (GCZ2026) falling $126, or 2.9%, to settle near $4,252 an ounce. The drop pushed the metal decisively below a cluster of technical support levels that had been taken out just recently.
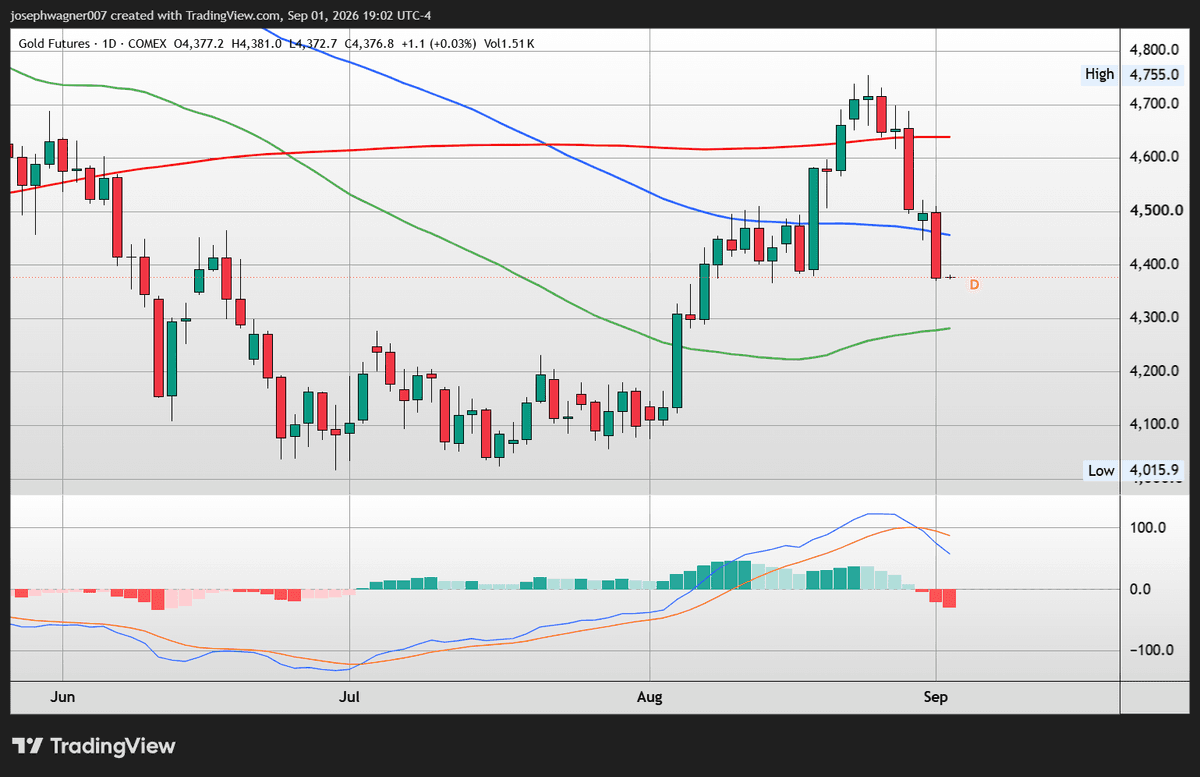
The catalyst was renewed hawkishness from Federal Reserve Chair Kevin Warsh, who reiterated that the central bank still has "work to do" in bringing inflation back to target. Combined with persistent price pressures tied to the ongoing conflict in Iran, Warsh's remarks pushed traders to sharply reprice the odds of a rate increase at this month's Fed meeting — odds that, according to the CME Group's FedWatch tool, jumped to roughly two-thirds, up from well under 40% just a week earlier.
Higher rates raise the opportunity cost of holding a non-yielding asset like gold, and the shift in expectations was enough to override the metal's usual safe-haven appeal even as geopolitical tensions simmered. Rising Treasury yields compounded the move, pulling capital away from bullion and into rate-sensitive assets.
Tuesday's decline wasn't just a headline number — it marked a significant technical breakdown. Price sliced straight through the 0.236 Fibonacci retracement level at $4,425.7, a line drawn from the year's swing low near $4,015.9 up to the January/February high above $5,750. That level had provided support through several pullbacks over the past month.
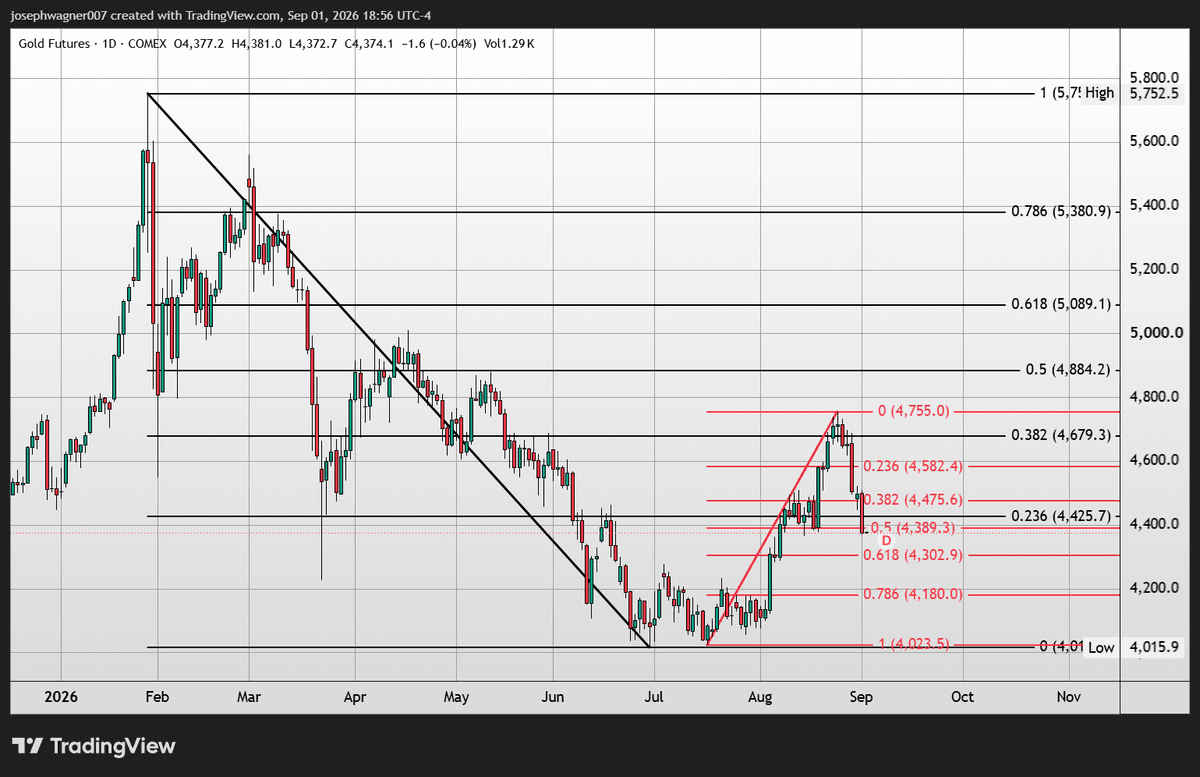
More notably, the sell-off pushed gold below two widely watched moving averages tracked on the daily chart. The medium-term 100-day(~4,455), and the long-term 200-day (~4,639) simple moving averages, for the first time since gold's sharp bounce off its August lows. It is also worth noting that all three of the major moving averages (50, 100, 200-day) are stacked in what market technicians refer to as being in full bearish alignment, with the longest-term average at the top and the shortest-term on the bottom.
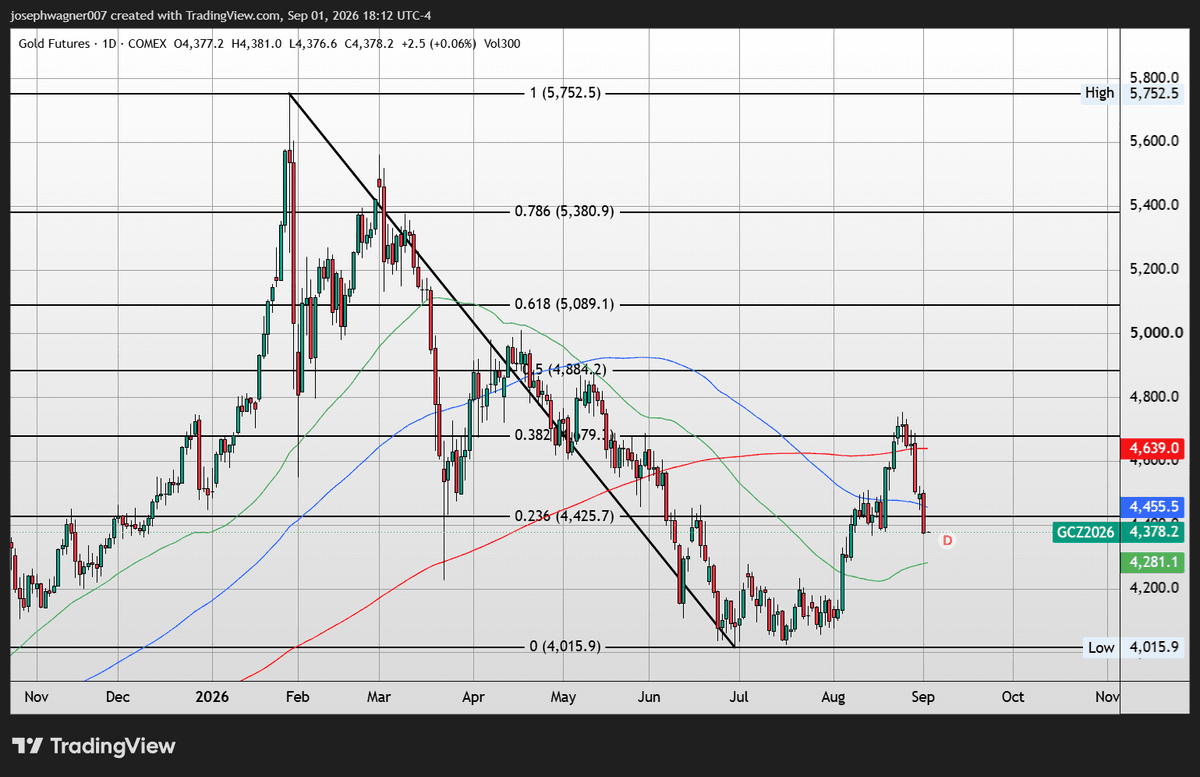
With Tuesday's slide, attention now turns to the broader consolidation zone that formed between June and July, when gold based in the $4,050–$4,300 range before its late-summer rally. That zone, and ultimately the year's swing low at 4,015.9, represent the next areas of interest if selling pressure persists.
Markets will be watching closely for further commentary from Fed officials ahead of this month's rate decision, along with any developments out of the Middle East that could shift the inflation and rate-hike calculus. For now, gold — still up sharply over the past year — finds itself testing whether 2026's bull run has more room to run, or whether the recent action will continue with gold getting dragged lower.
I firmly believe that 2026 holds much more gains for both gold and silver. Even with the past few weeks dramatic tumble this correction will only be short lived and in a matter of weeks to months gold will undoubtedly be back in full bull mode. This will be caused by macro events such as the renewed debasement trade, growing concerns of the immense US government debt, rising inflation, and longer-term yields continuing to climb.
For more daily market commentary and analysis, visit thegoldforecast.com.
Wishing you, as always, good trading.
