
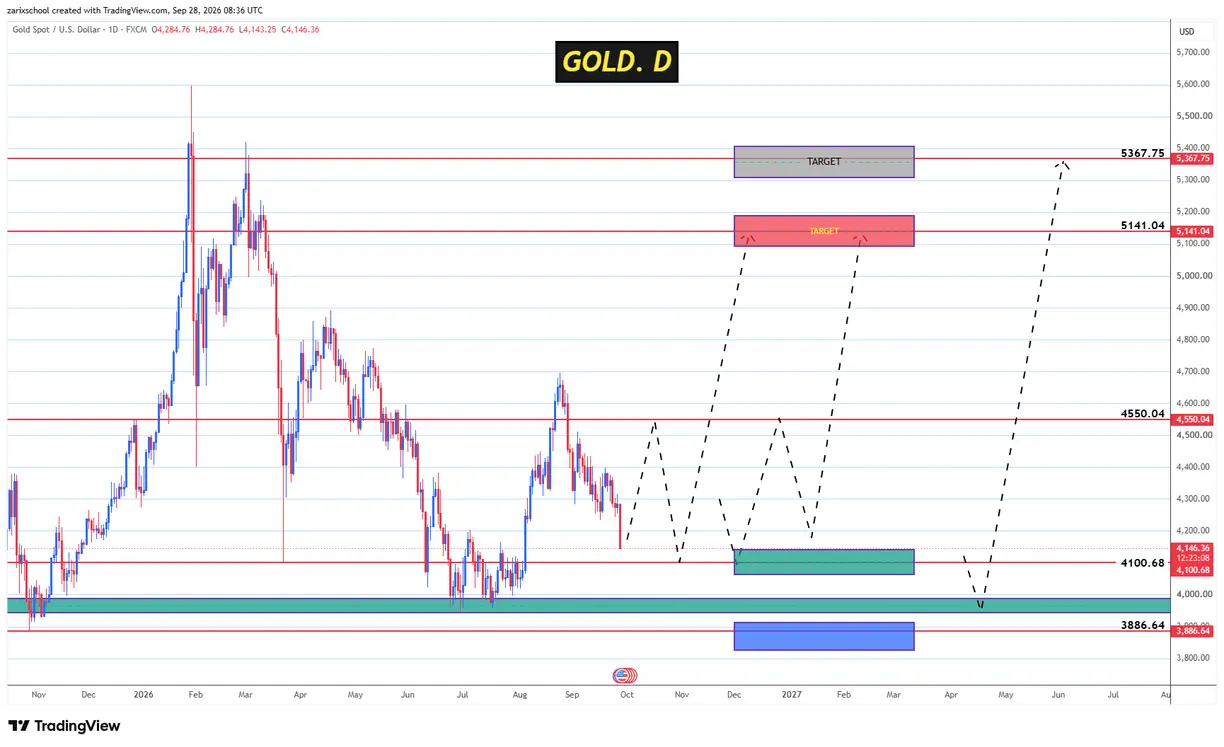
Gold remains under pressure on the daily chart, but the current decline is bringing the market closer to an area that could determine whether the correction develops into something deeper or begins to establish a more durable low.
The immediate focus is on $4,100.68. Below that, the broader support area around $3,946.74–$3,886.64 represents a second and potentially more important test.
These levels matter because the larger structure still leaves room for a recovery if buyers return from either support area. The challenge is timing: gold has not yet provided enough evidence on the daily chart to confirm that the correction is complete.
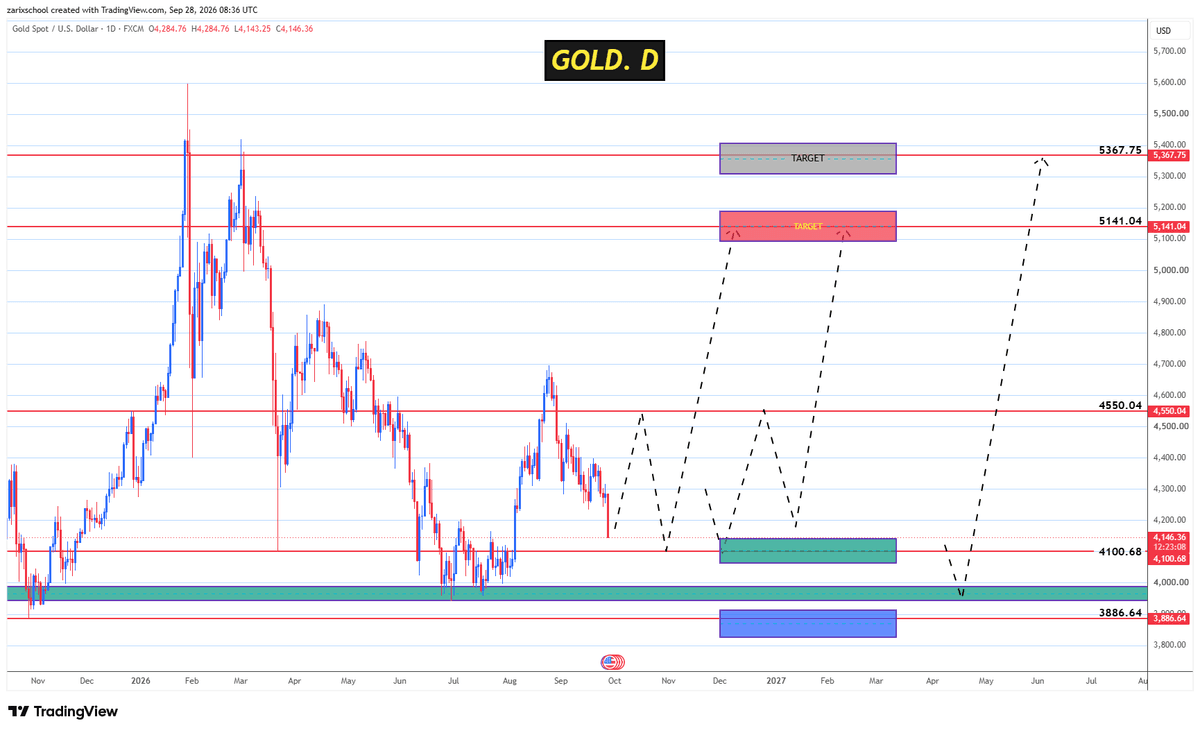
Gold daily chart showing potential support at $4,100.68 and $3,946.74–$3,886.64, with upside resistance at $4,550.04, $5,141.04 and $5,367.75.
The correction may still have further to run
Gold's recent price action remains corrective. The market has pulled back sharply from its August high and, on the daily chart, the latest decline has not yet produced a confirmed reversal.
That keeps the downside scenario active.
The first area I am watching is around $4,100.68. A meaningful reaction there could begin the process of building a daily low, but support alone would not be sufficient confirmation. I would want to see price respond and then reclaim higher levels before treating the correction as complete.
If $4,100.68 fails to hold, attention shifts to the deeper support region around $3,946.74–$3,886.64. This area overlaps with the broader base visible on the chart and would represent a more substantial test of the longer-term bullish structure.
The important distinction is that a move into either support area would not automatically constitute a buy signal. The reaction after price reaches support is more important than the level itself.
What would confirm that gold has turned higher?
A recovery from support would first need to change the short-term structure.
The $4,550.04 level is particularly important in that respect. A sustained recovery above this area would provide stronger evidence that the market has moved beyond a temporary bounce and is beginning a broader recovery.
Until that happens, rallies should be viewed within the context of an unfinished correction.
If gold can establish a low and later regain $4,550.04, the technical picture becomes considerably more constructive. That would bring the higher resistance areas back into focus.
$5,141 and $5,367 remain the major upside areas
The first major upside objective shown on the chart is $5,141.04.
This is not an immediate target from current prices. Gold would first need to establish support, reverse the daily correction and reclaim intermediate resistance. If those conditions are met, however, $5,141.04 becomes an important area to watch for the next significant reaction. Above that sits $5,367.75.
This is the higher resistance area in the current structure and represents the more ambitious recovery scenario. A move toward this level would require a much stronger change in momentum than anything confirmed on the chart today.
For that reason, I view $5,141.04 and $5,367.75 as conditional upside objectives rather than forecasts that price is certain to reach.
Two paths could lead to the same larger setup
What makes the current gold structure interesting is that the market does not necessarily need to bottom at one exact price.
One scenario would see the correction stabilize around $4,100.68, followed by a recovery through $4,550.04.
The alternative is a deeper decline into the $3,946.74–$3,886.64 region before buyers regain control.
Both paths remain technically possible. What matters is whether gold can establish a credible low at one of these support areas and subsequently recover through resistance.
That is why trying to identify the exact bottom in advance is less useful than watching how price behaves when it reaches support.
The levels that matter from here
For now, $4,100.68 is the first downside level I am watching. If it holds and price begins to recover, the case for a developing bottom would strengthen. A failure there would keep the correction active and shift attention toward $3,946.74–$3,886.64.
On the upside, $4,550.04 is the first major level that would materially improve the daily technical structure. Beyond it, $5,141.04 and ultimately $5,367.75 would become the larger resistance areas to monitor.
Gold is therefore approaching an important phase of its correction, but the reversal itself still needs to be demonstrated by price. The support zones identify where a bottom could develop; the subsequent recovery through resistance would provide the evidence that it actually has.
