
Oct 13, 2026
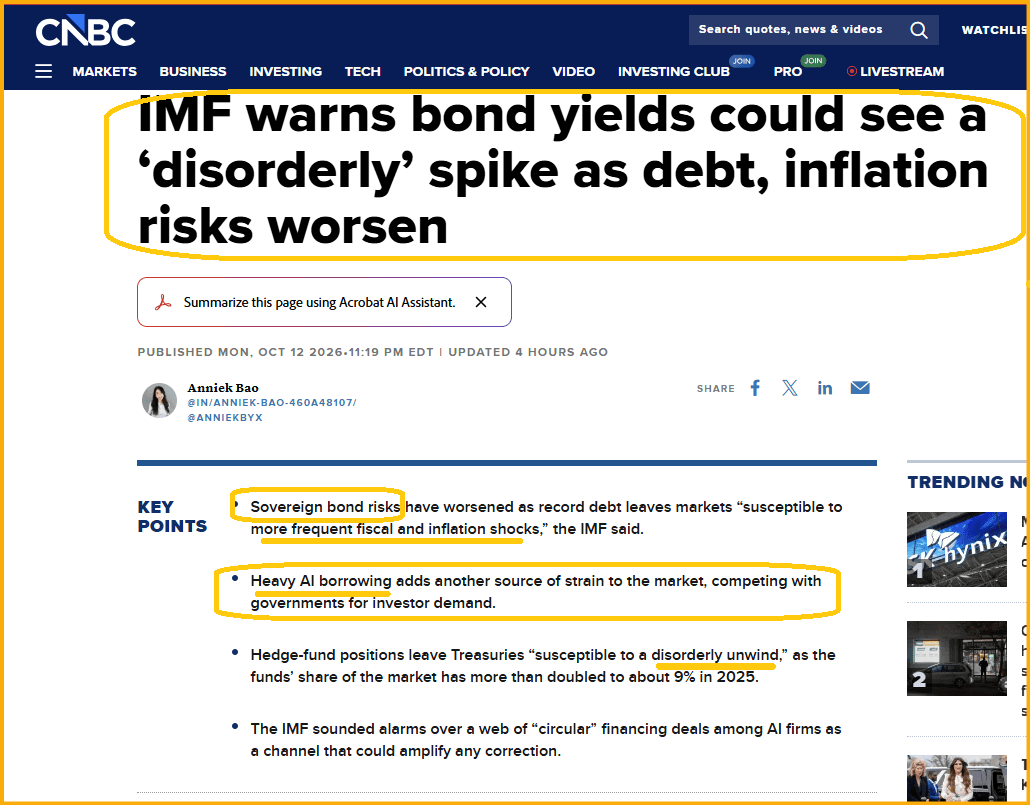
1. Money continues to flow into sovereign bonds around the world… but what kind of money is it?
2. First, it’s fiat money, and that’s a problem. Second, it’s money that’s aggressively leveraged by hedge funds, which is another big problem.
3. Could the next global crisis be a sovereign debt crisis?
4. It could, and to view the IMF’s take on this disturbing matter. In a nutshell, while hedge funds gamble on sovereign debt, there’s an institutional stampede into high-risk AI bonds.
5. The obvious question for all citizens of the world: Got gold?
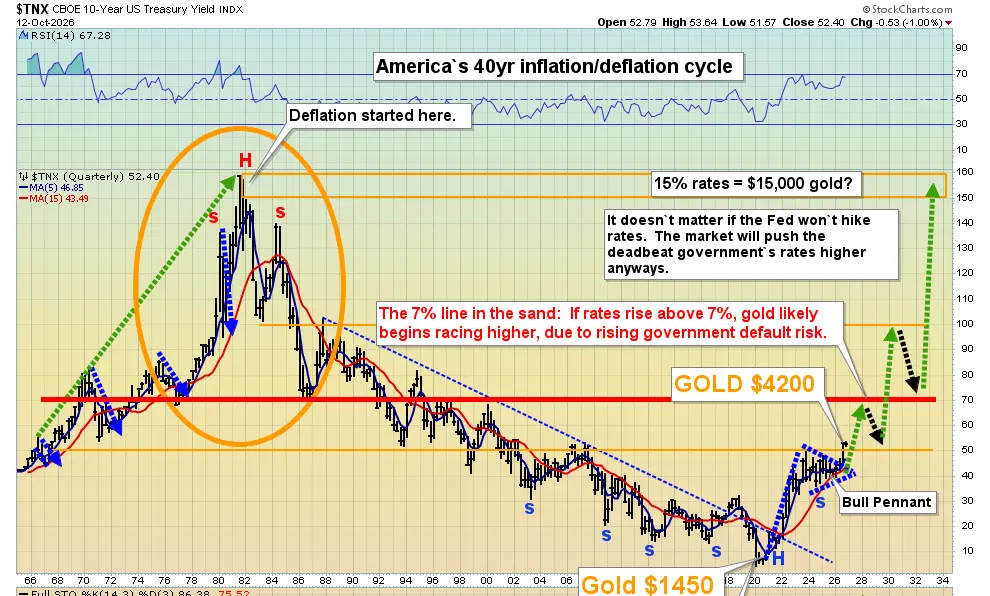
6. High rates destroy most debtors, and the threshold for widespread destruction of government debtors is likely 7%-8%, basis US 10year debt.
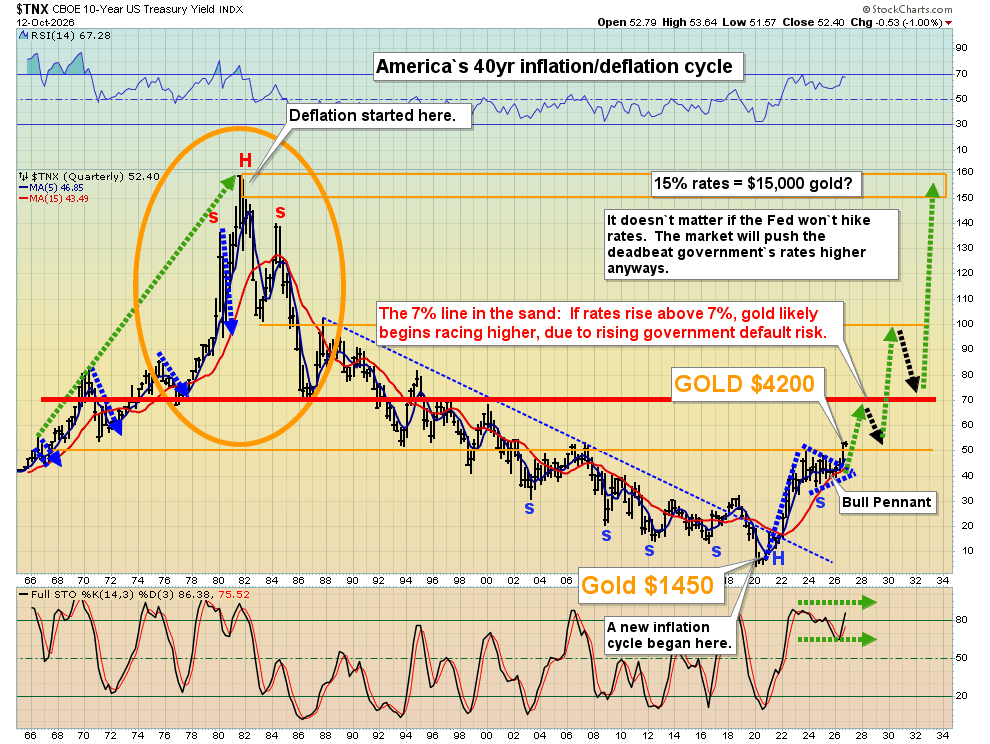
7. Interestingly, gold has already moved from about $1450 to $4200… while rates have climbed from near-zero to over 5%.
8. Having said that, the biggest short-term spurts in gold have generally occurred when rates and the dollar index have fallen in tandem.
9. While a sovereign debt crisis can drive gold tens of thousands of fiat dollars higher, when rates are well below the 7%-8% line in the sand, money managers, hedge funds, and retail investors are focused on the fact that gold pays no interest (in the West).
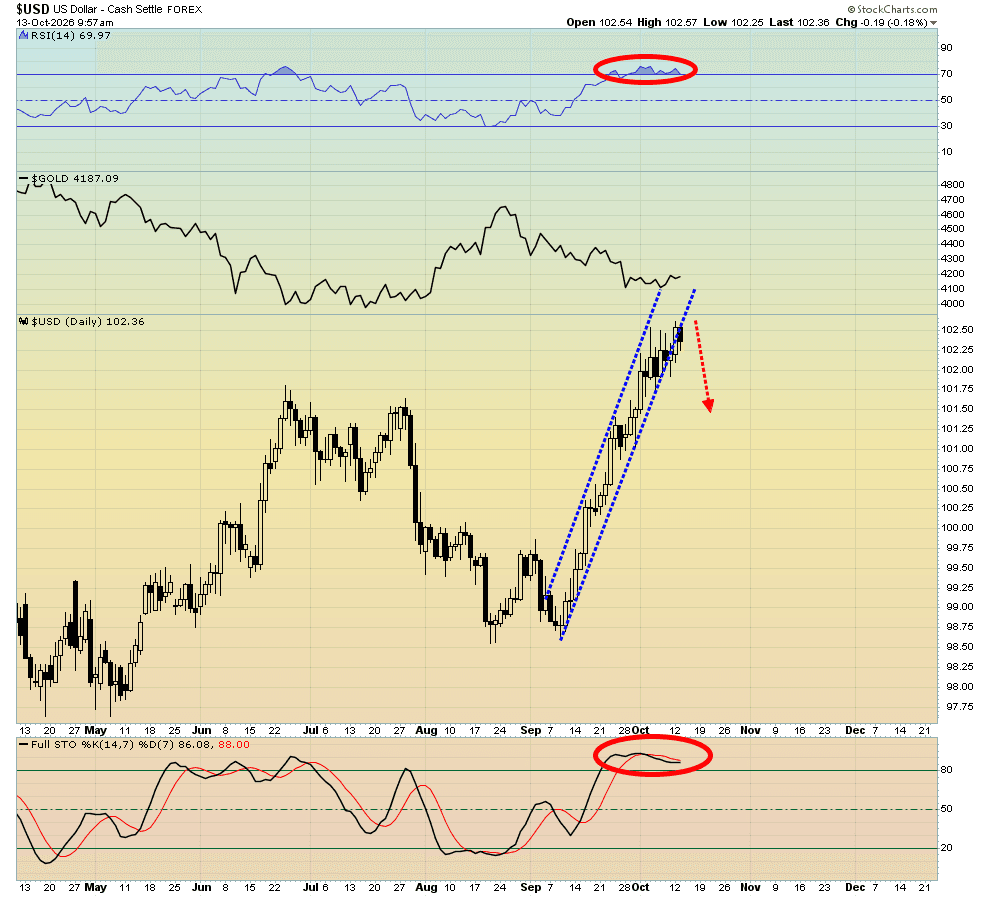
10. The dollar is significantly overbought on the daily (short term) chart. RSI and Stochastics both have technical “nosebleeds”.
11. Double-click to enlarge this short-term US 10year rates chart. It’s also overbought. The uptrend line is being tested, and is likely to fail.
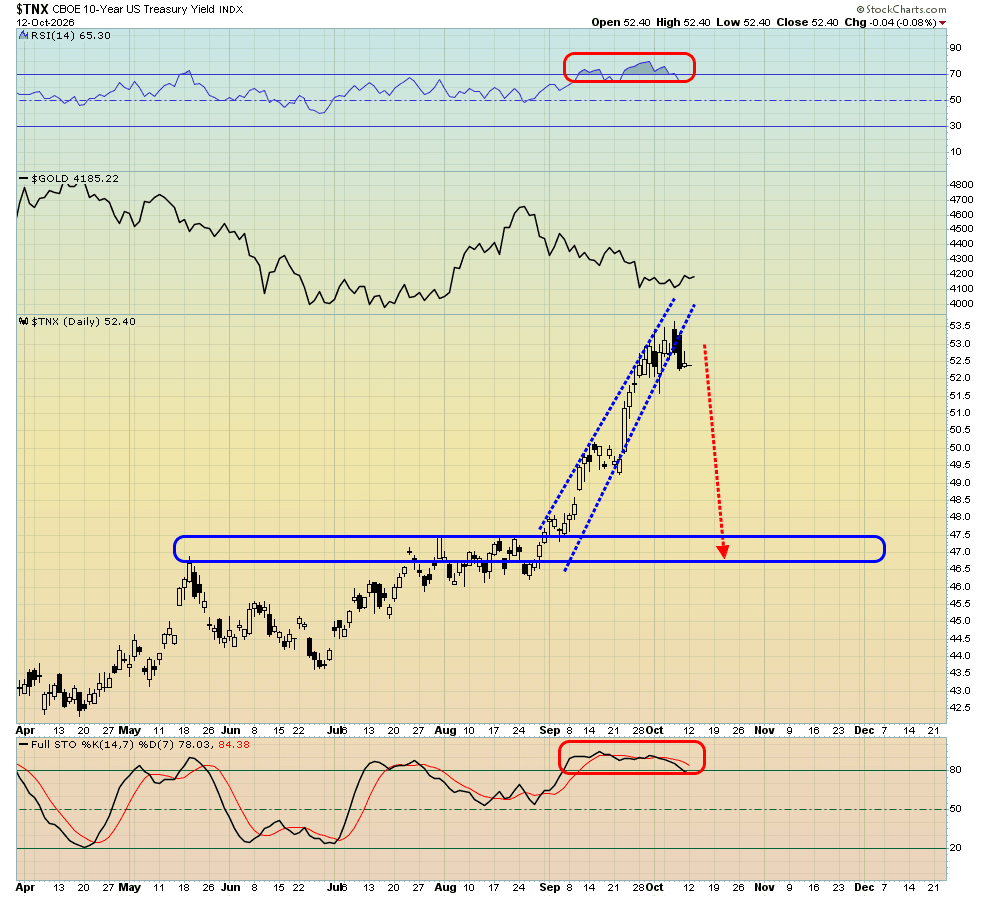
12. That’s good news for gold.
13. A double bottom has morphed into a bullish inverse H&S pattern.
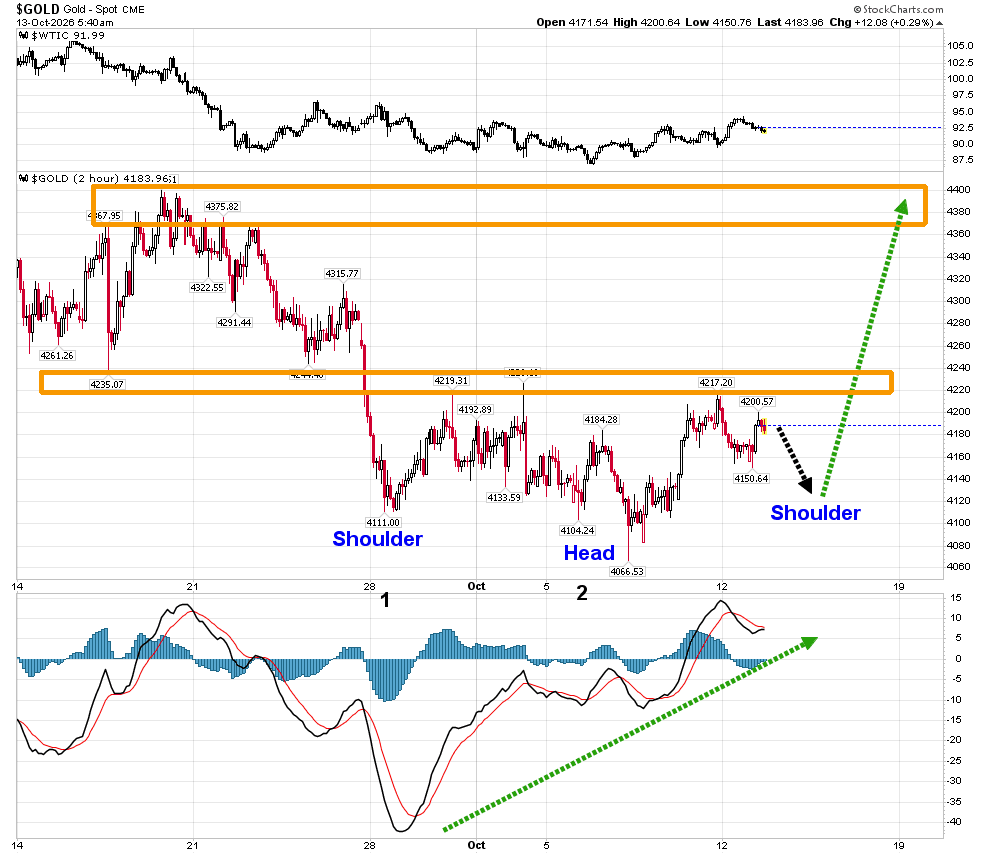
14. The target zone is the $4400 area highs.
15. Stochastics is dramatically oversold and poised for both a buy signal and breakout.
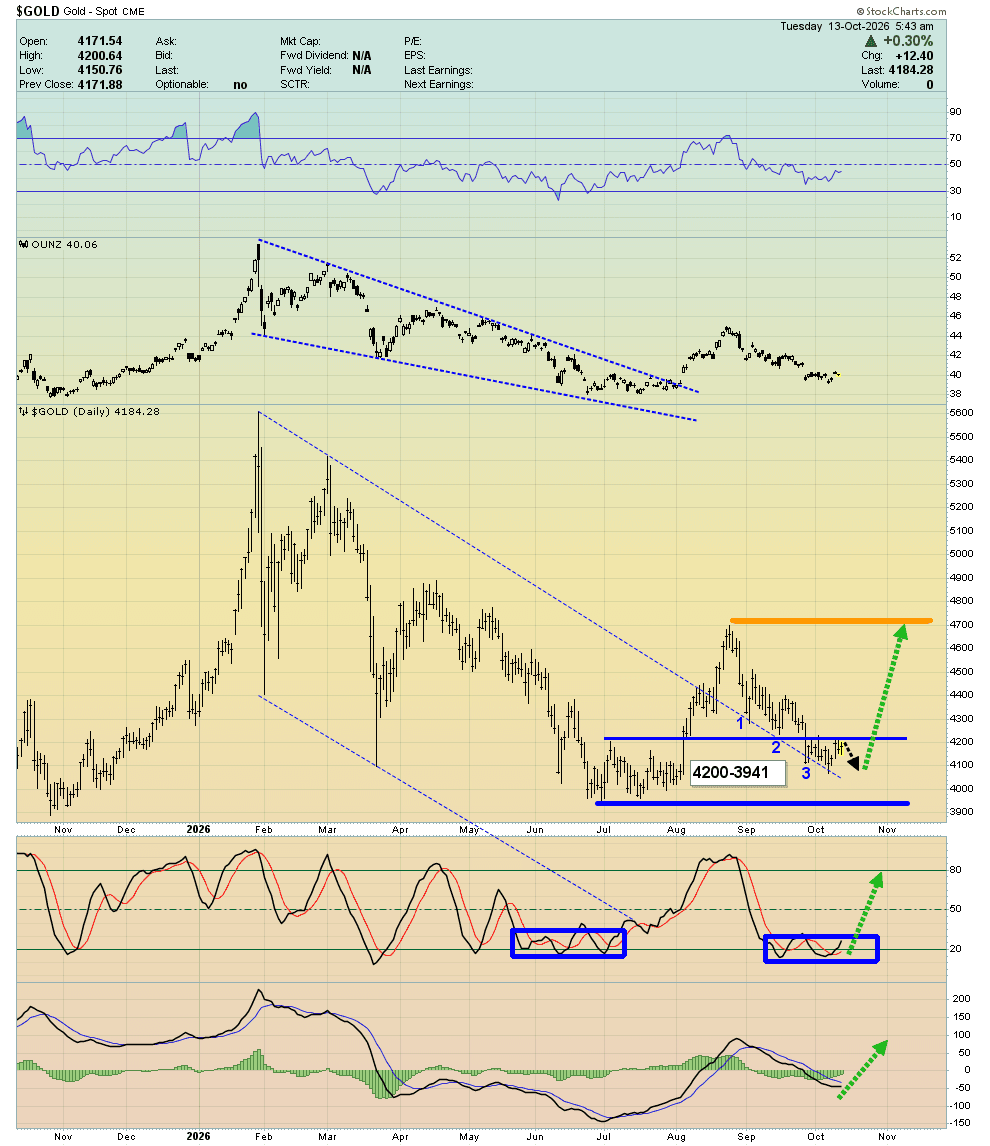
16. That’s occurring as gold steadies in my $4200-$3941 buy zone. It’s a buy zone for not just gold, but for silver and miners too.
17. A loose but large inverse H&S pattern targets the all-time highs.
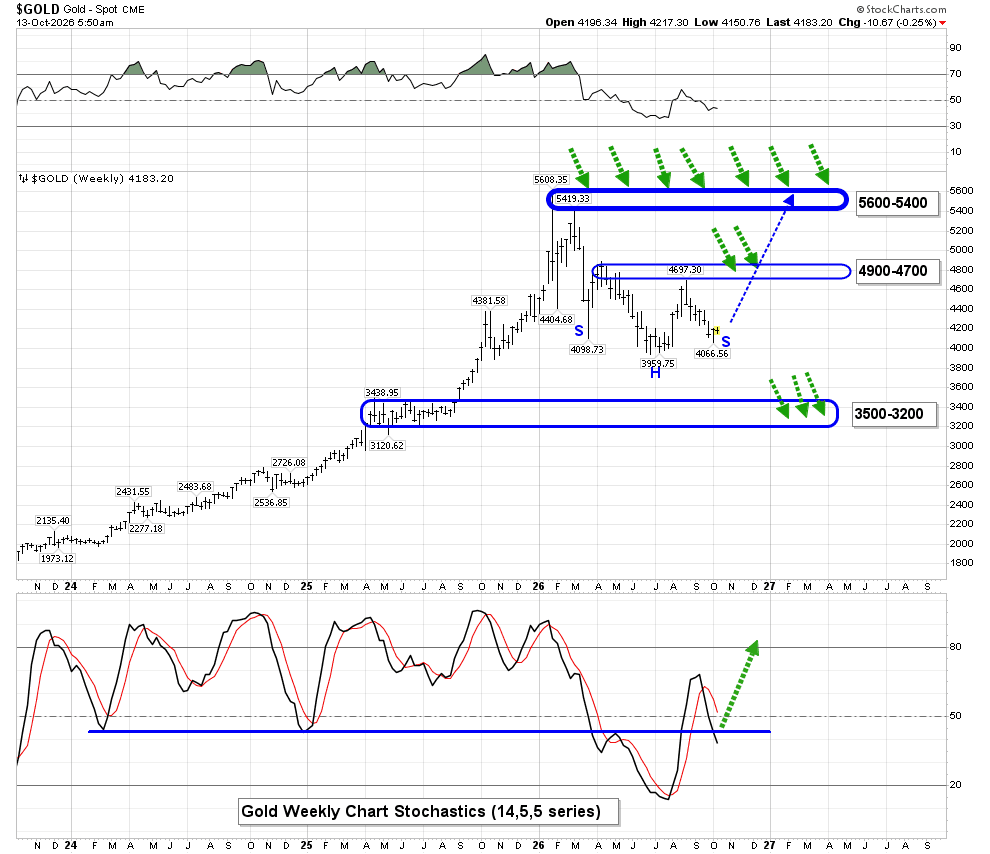
18. While it’s unlikely that gold trades at the buy zone of $3500-$3200, investors should be ready to buy there anyways. That’s because the fragile state of the global bond market means… “Anything can happen!”.
19. Given the potential for a US dollar and interest rate tumble, once this week’s CPI and PPI inflation reports are out of the way, what’s most likely is a surge to $4700, and then to $5400.
20. What about the miners? Well, while the gold charts look good, the mining stock charts look truly spectacular.
21. For a look at an important one. Double-click to enlarge this “wow factor” GDX chart. The inverse H&S target is about $130-$140 and…
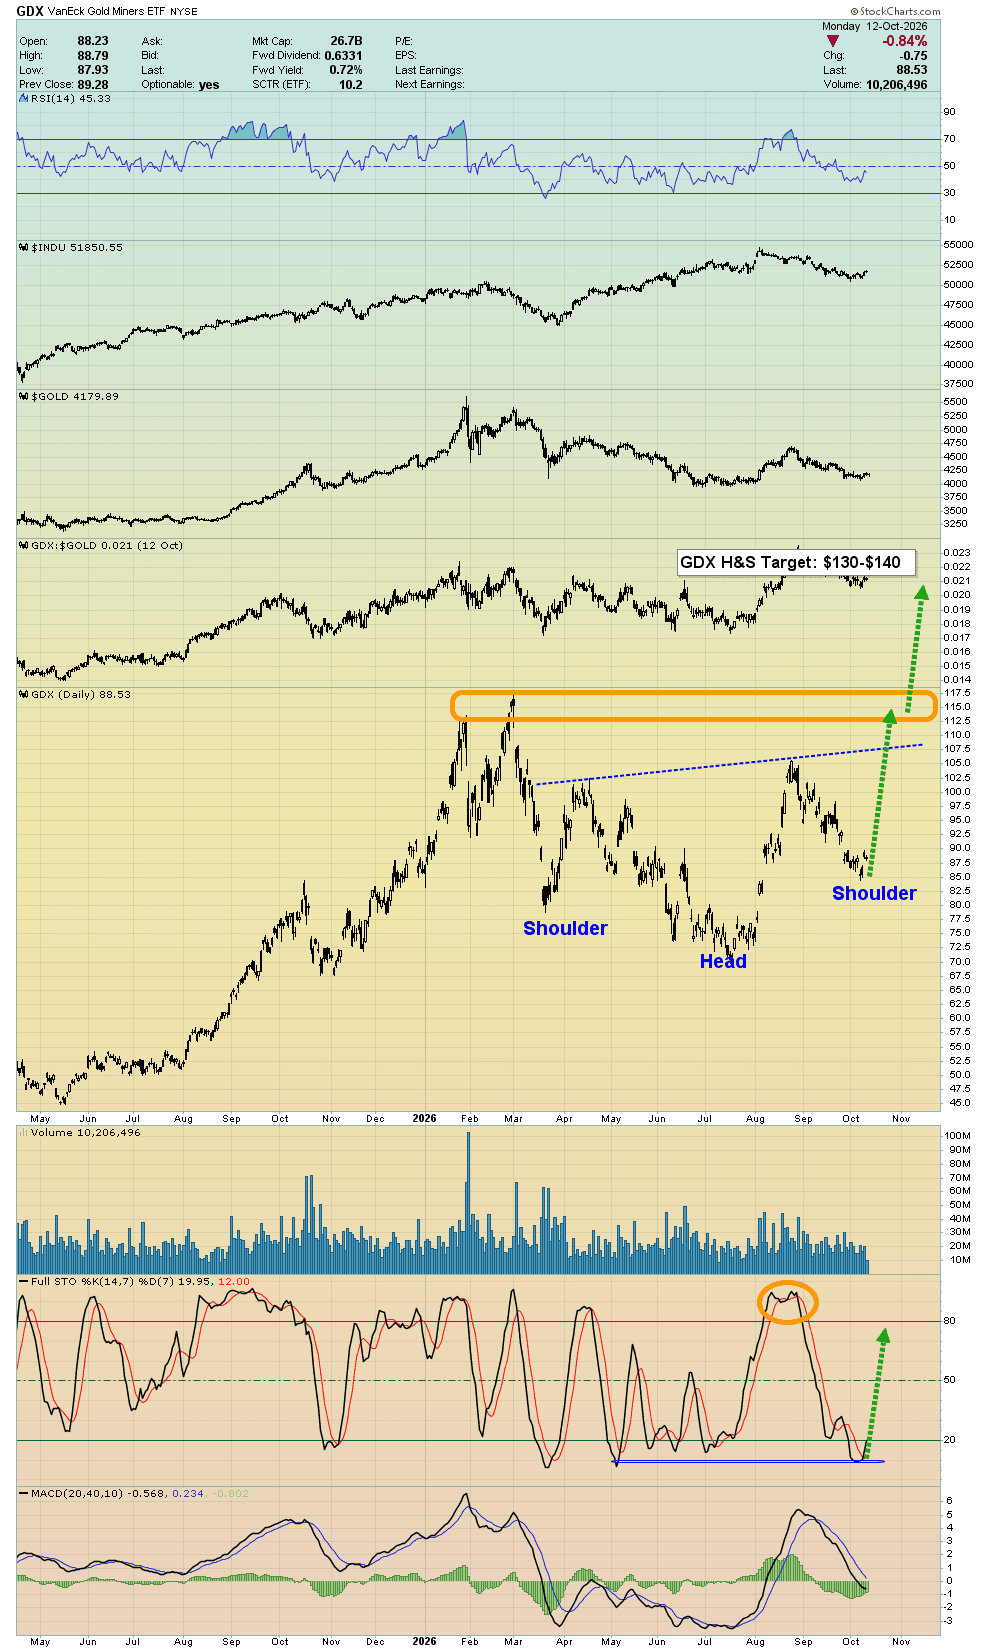
22. Gold stocks are benefitting from the arrival of gold at the big $4200-$3941 support/buy zone, and from the Dow’s arrival at its significant support/buy zone of 50,500.
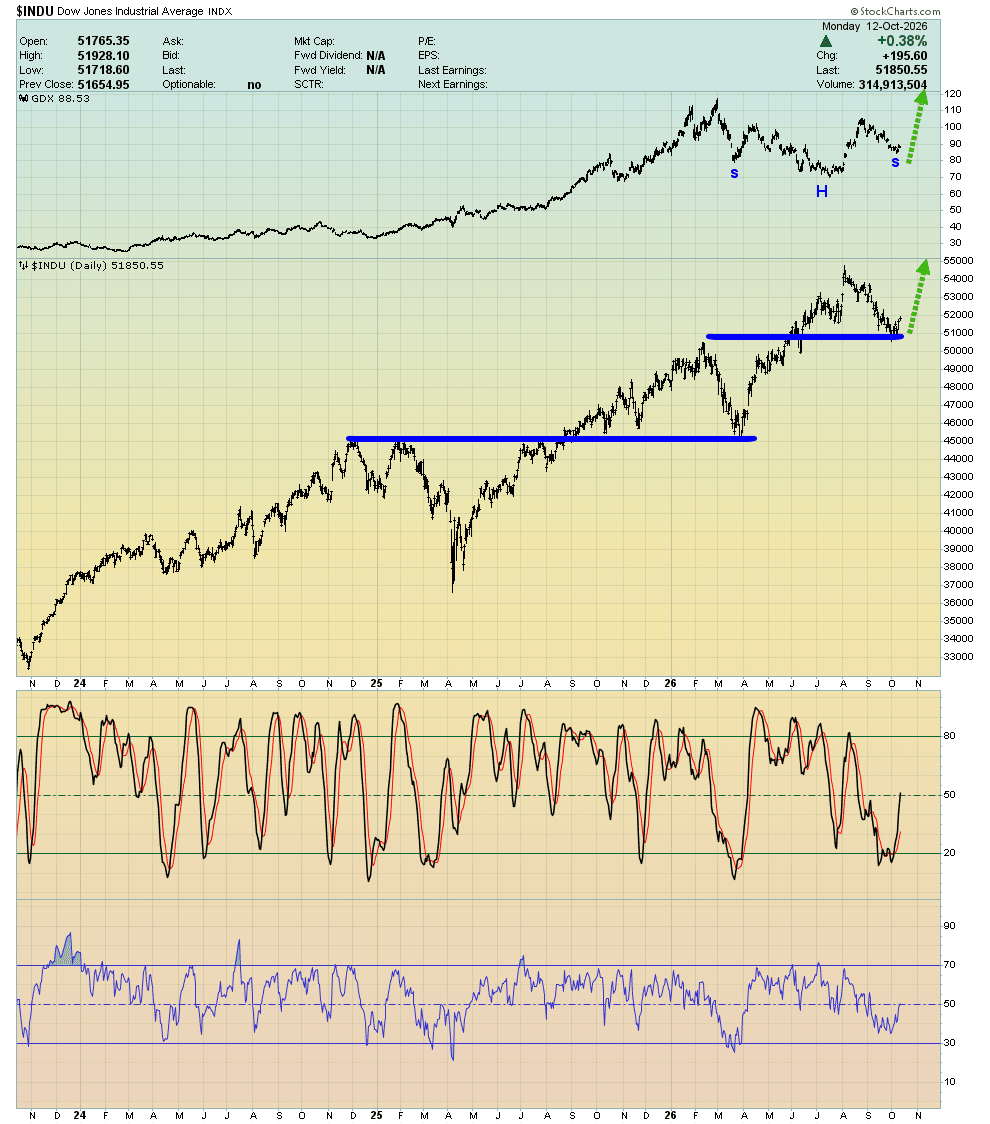
23. It’s clearly win-win time for gold; a rise to 7%-8% for US rates financially annihilates a lot of global sovereign debt and probably makes the US government look like gold bull era roadkill but…
24. With rates in the 5% area now, a fall to about 4% is likely, and that could help blast gold to $5400 and GDX to fresh all-time highs in the $130-$140 zone!
Thanks!
