
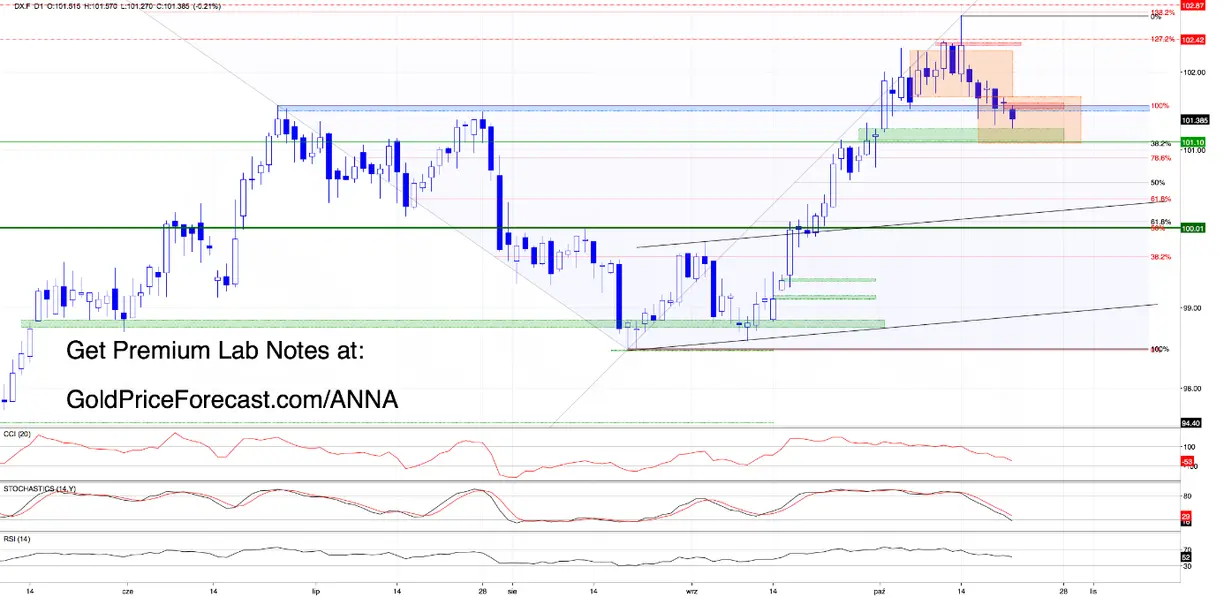
The U.S. dollar is under pressure, approaching a support area we've been watching for several sessions.
Normally, that might encourage expectations of strength in gold, but gold has its own story to tell. Instead of launching a convincing recovery, sellers have pushed prices within a few points of a downside objective we identified last week. Meanwhile, an important weekly bullish gap is facing another serious test.
It's a reminder that a favorable relationship between markets is not the same thing as a confirmed trading signal.
This morning, both charts offer important technical information - and both still have unanswered questions.
U.S. Dollar (DX.F) - Relief Lasted One Session
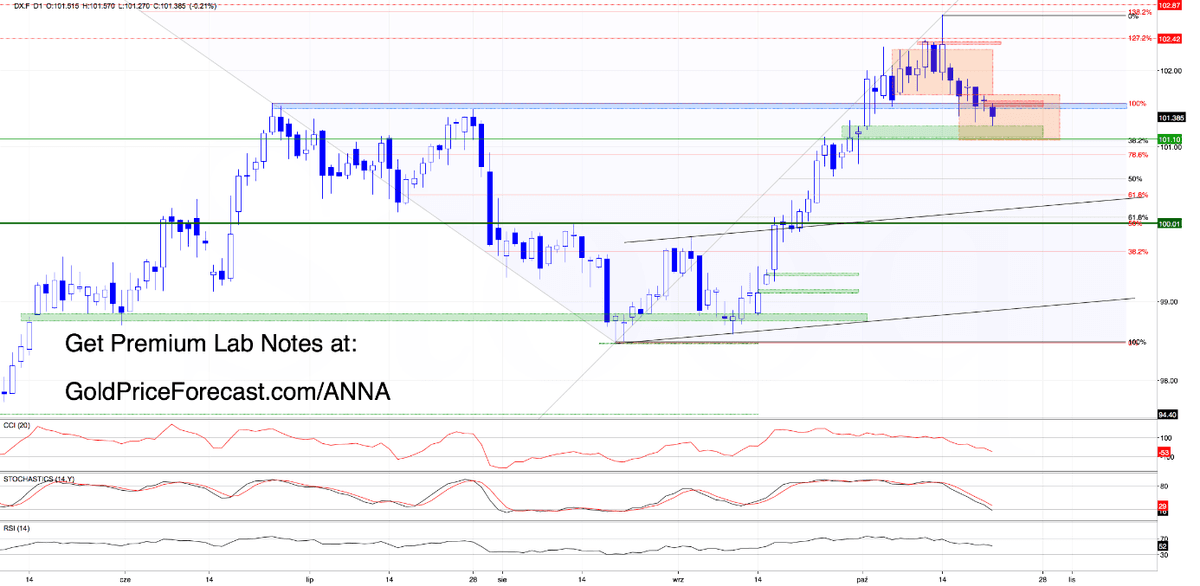
Wednesday gave dollar bulls a modest victory: the daily close invalidated the previous breakdown below June's high. But it did not restore the orange consolidation at 101.67-102.27, and the confirmed invalidation of the weekly rising-wedge breakout remained intact.
Thursday began with a fresh bearish gap at 101.51-101.60. Sellers pushed the index back beneath the June and July reference highs intraday, reaching 101.27 before a modest rebound. They came within 0.01 of the upper boundary of our anticipated support cluster but have not entered that cluster yet.
The next area to monitor is 101.11-101.26, built from the bullish gaps of September 30 and October 1. Just beneath it, the 38.2% Fibonacci retracement around 101.10 meets the orange consolidation's measured downside projection near 101.07.
This is the confluence highlighted in yesterday’s Free Lab Note, not a promise of an exact turning point.
The new bearish gap remains open at the time of writing. As long as DX.F stays below it, the former highs and 101.67, sellers retain the stronger technical argument.
A recovery above those barriers would weaken the immediate bearish case. Only today's close can establish whether the renewed breakdown below the highs is confirmed.
Daily Takeaways
- Bearish pressure: new gap at 101.51-101.60; intraday low at 101.27.
- Support: 101.11-101.26, followed by the 101.10-101.07 confluence.
- Confirmation: watch whether the daily close recovers the June-July area.
Bottom Line: Wednesday's rescue did not repair the broader damage. Sellers are already testing how much of it can be undone.
Gold (GC.F) - A Target Almost Reached, a Weekly Gap on Trial
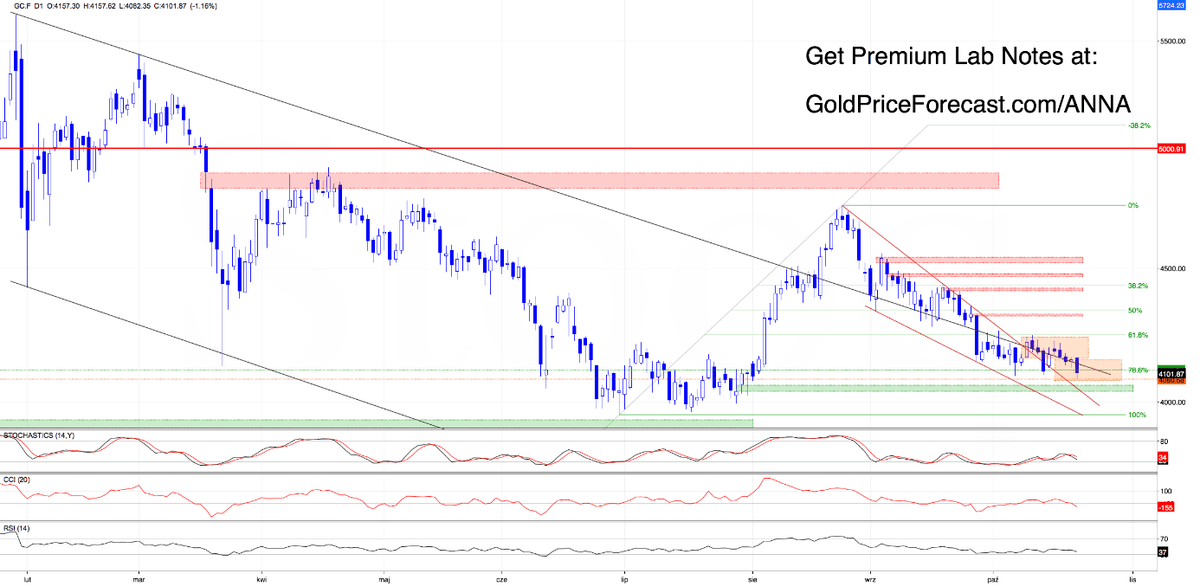
Gold's inability to capitalize on a falling dollar has become more than an interesting divergence in behavior.
Sellers have now carried prices almost to the 4080 downside objective identified after the orange consolidation broke in Free Lab Note posted on Oct.14, 2026.
Thursday's low: 4082.35.
The target has been approached, not technically reached.
That decline also swept through the entire 4098-4135 weekly bullish gap intraday. Price was around 4101.87 at the chart snapshot, making the battle for its lower boundary especially visible (an intraday passage below 4098 cannot, by itself, establish a confirmed weekly gap closure because that requires a weekly close below 4098). The daily 78.6% Fibonacci retracement near 4113.74 lies within the same zone, but it has not prevented the latest selloff. Stochastic has generated a sell signal, while CCI and RSI remain weak.
If buyers cannot defend the weekly gap into Friday, the next technical support combination is 4036-4060: the July 30 bullish gap and the upper boundary of the red falling wedge, currently around 4050.
Those are conditional levels, not a forecast that they must be reached.
Even a rebound would have work to do. 4156 is the nearby level to reclaim; 4233 and especially 4240-4250 remain the real test of bullish strength.
Daily Takeaways
- Bearish objective: 4080 nearly reached.
- Critical support: weekly gap 4098-4135 breached intraday, not confirmed closed.
- Next risk: 4036-4060 if the weekly defense fails.
Bottom Line: A weak dollar has not rescued gold. The weekly closing price now matters more than another hopeful intraday bounce.
And What About the Other Metals?
Gold isn't the only metal experiencing selling pressure.
Silver is testing an important support combination following repeated failures to reclaim its broken declining channel. Platinum's four consecutive bullish opening gaps have given way to a powerful bearish counterattack. Palladium has reached two previously discussed downside objectives, while copper has completed the minimum measured decline from its recent consolidation.
Final Thought - Forecasts Meet Evidence
A target reached is worth noting. A structure lost is worth checking. But an intraday break is not a finished verdict.
Let the daily and weekly closes tell us what actually changed.
