
After trading in the futures and commodities markets for the past 23 years, one thing I know is to be uncomfortable when markets seem to be comfortable. I don't care if it is Gold, Silver, Crude, Copper, or Cocoa; these markets are often the calmest before the storm. Take Cocoa, for instance. This commodity is heavily dependent on fertilizer and pesticides supplied by Russia, ideal weather, and an economy that is neither "too hot nor too cold." Fast forward to 2023, Russia has stopped exporting fertilizer and pesticides, drought and flooding occur, and the economy heats up to unsustainable demand. The result, you ask? Cocoa rallies from $4000/ton to $11,722/ton, and the average true range (ATR *what your trading account will experience on a "typical" day) is a swing of $10,000 per contract because the contract size is ten metric tons.
What does that have to do with Gold and Silver? That is why you are here and why thousands of people tune into the "Metals Minute" daily, where I break down key levels and actionable trade ideas in Gold, Silver, Crude oil, and the S&P 500 every trading day. Register for a free two-week trial here: Get the Metals Minute.
Daily Gold Chart
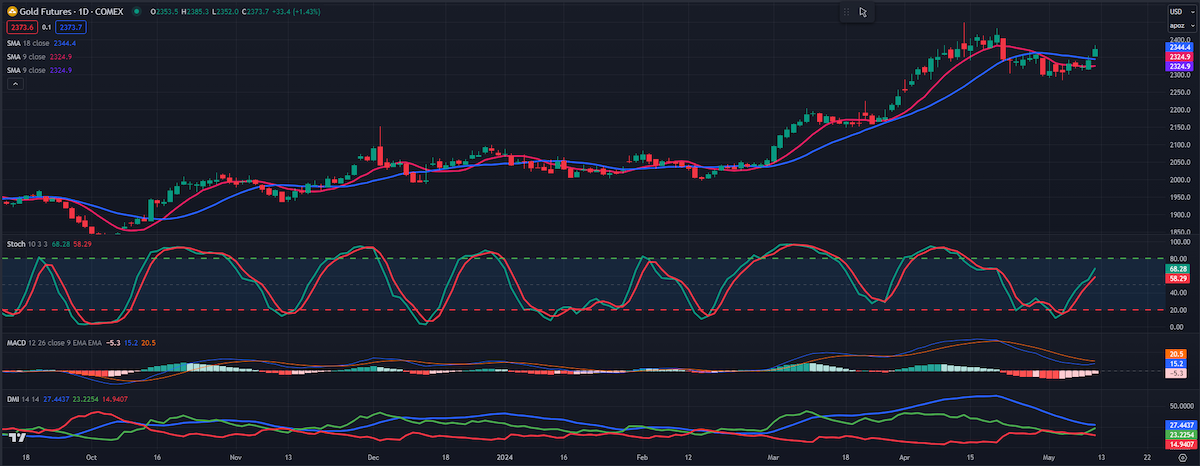
A "breakout" occurs when prices pass through an area of support or resistance and exit a current area pattern. When a breakout occurs, it often leads to a new chart pattern and often results in a new trend. For several trading sessions, Gold futures have been trading in a sideways channel, trapped between two major levels of support ($2300, psychological support, and the 50 DMA, $2281) and resistance of $2351, where active traders have taken profits and initiated short positions.
To help you develop a technical trading strategy, we have recently updated our "5-Step Technical Analysis Guide," which will provide you with all the Technical analysis steps to create an actionable plan used as a foundation for entering and exiting the market. You can request yours here: New 5-Step Technical Analysis Guide.
When a breakout occurs, those traders cover their short positions, and the traders that took profits at $2351 will often re-enter the market in anticipation of a higher move. Gold traders are now solely focused on four main drivers: Chinese Central Bank buying, ETF inflows, inflation, and employment data. Last week, we saw a drop in the payroll data and an uptick in initial claims, which often is an area of the economy that starts to show cracks first. Next week, we will see inflation data readings on PPI and CPI, where expectations for the first interest rate cut could be pulled forward from the Fed.
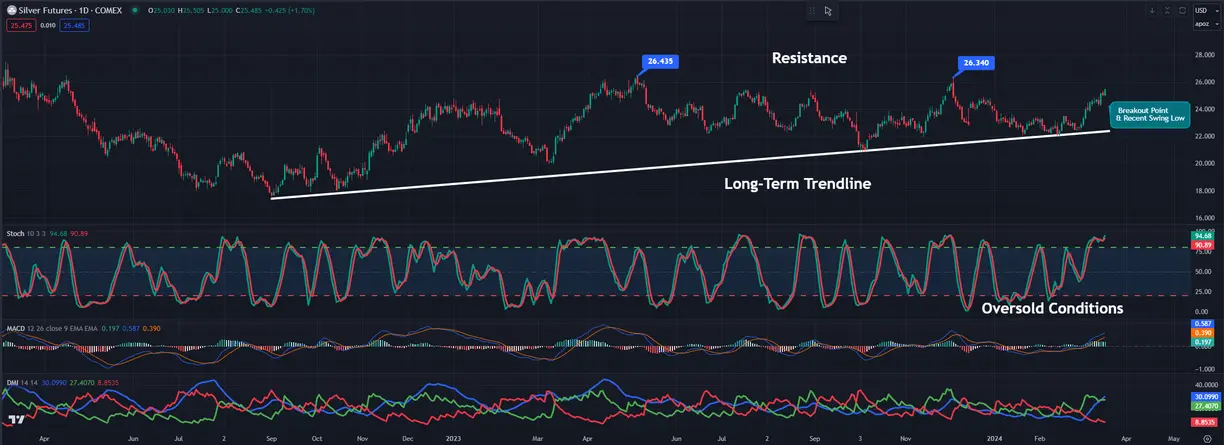
Daily Silver Chart
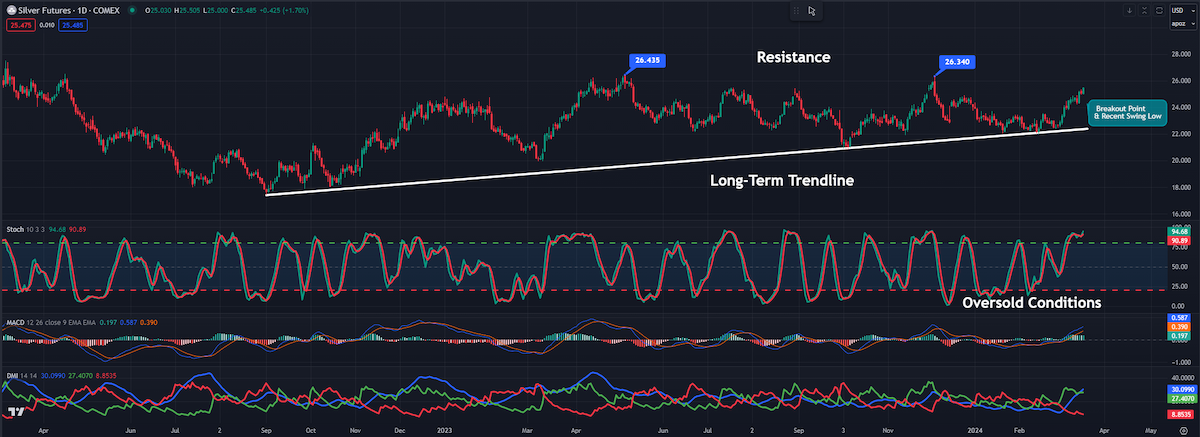
Regardless of whether the first cut comes in June or September, we should see a chain reaction of events leading to a weaker U.S. Dollar followed by a steady stream of fund inflows into the Gold market. Historically, Gold has, on average, seen a 6% rise within 30 days of the first interest rate cut. Additionally, the Gold/Silver ratio is trading near 82:1, leaving Silver at a historically low valuation compared to Gold. With Silver's high beta nature, the returns in Silver after the first interest rate cut could significantly outperform Gold.