
Aug 18, 2026
1. In 1973, the OPEC oil supply crisis sent gold soaring… while US rates surged.
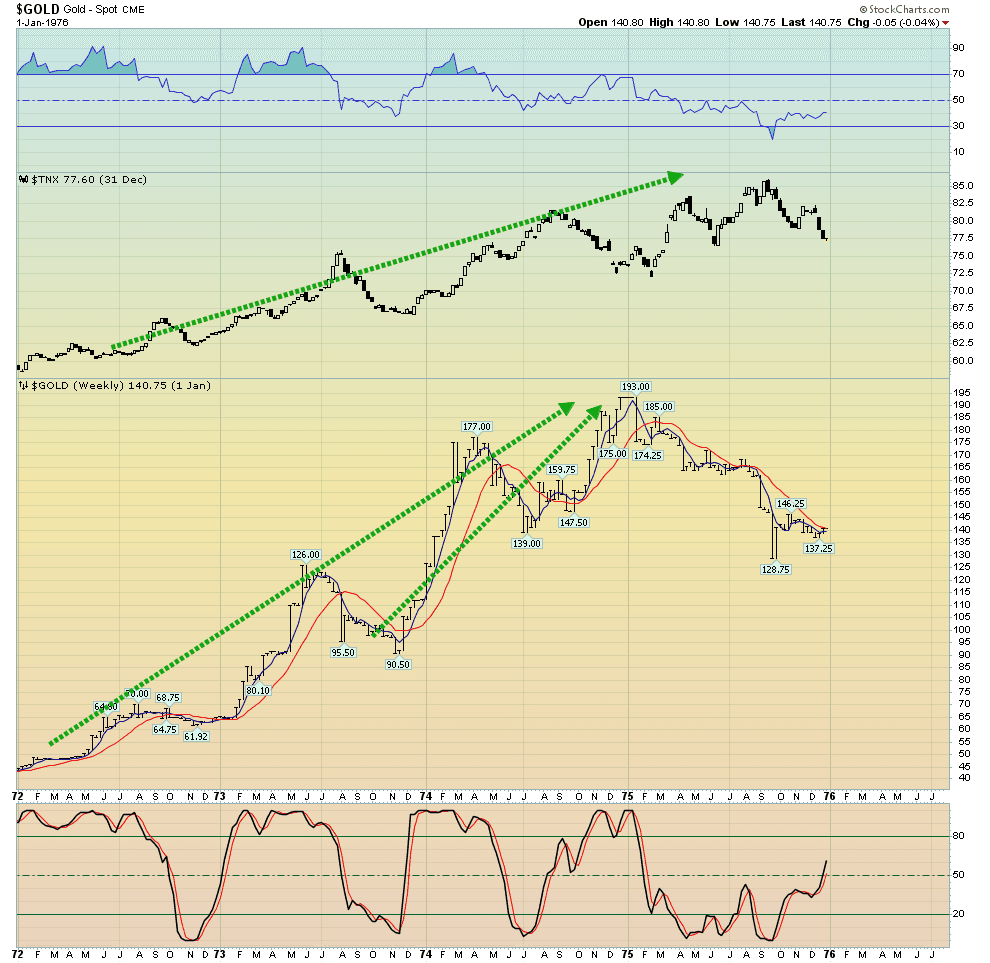
2. Today, fiendish government narrators have promoted a macabre scenario where skyrocketing oil and rising rates is supposedly very negative for gold.
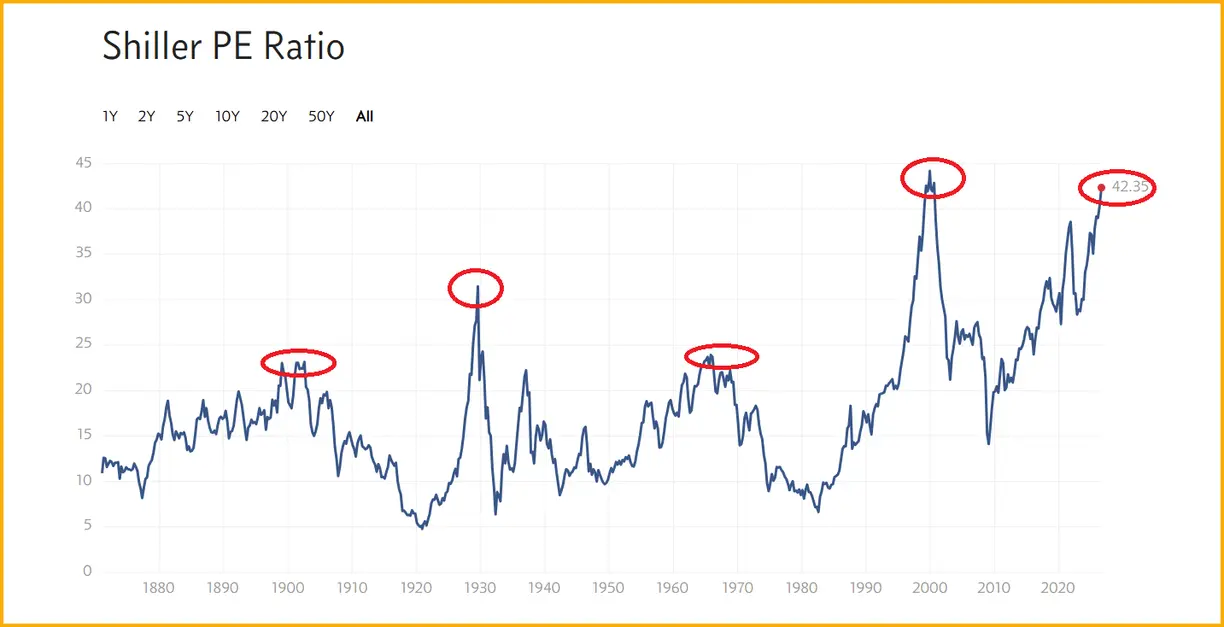
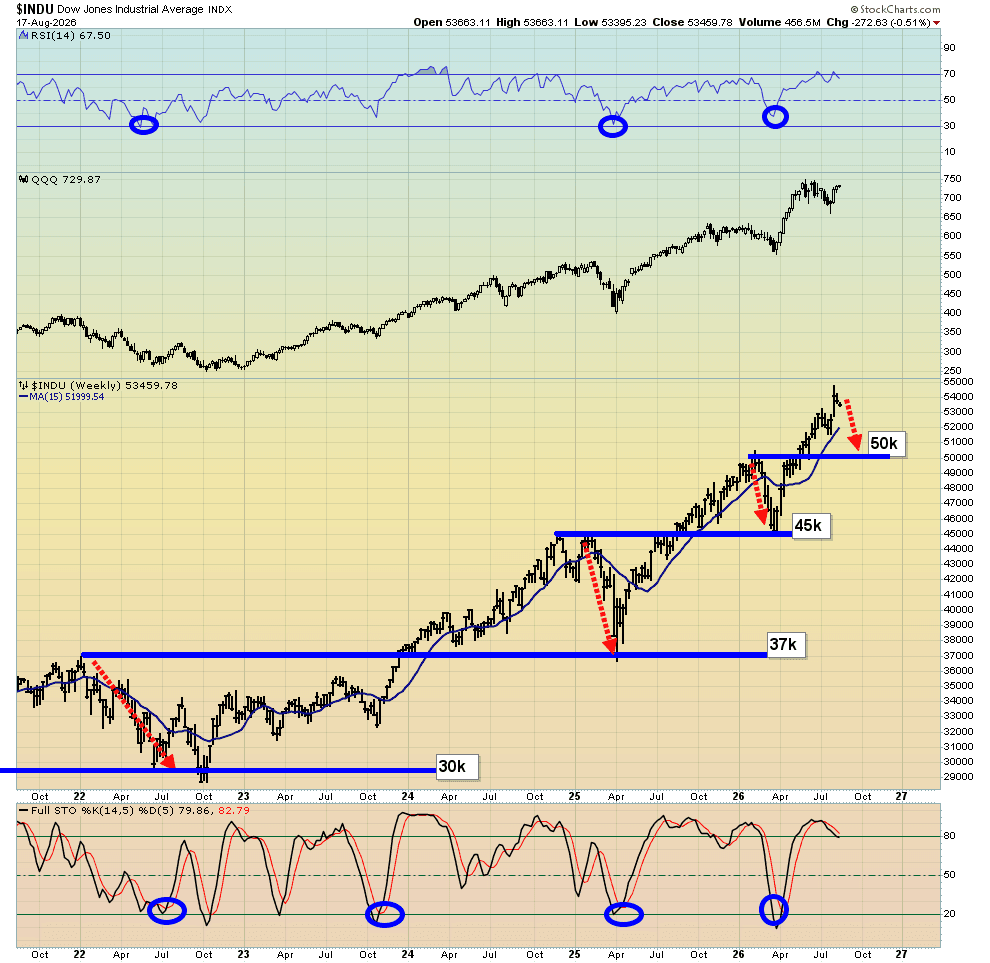
3. As long as the outrageously overvalued stock market doesn’t collapse, this false narrative stays alive, albeit on life support.
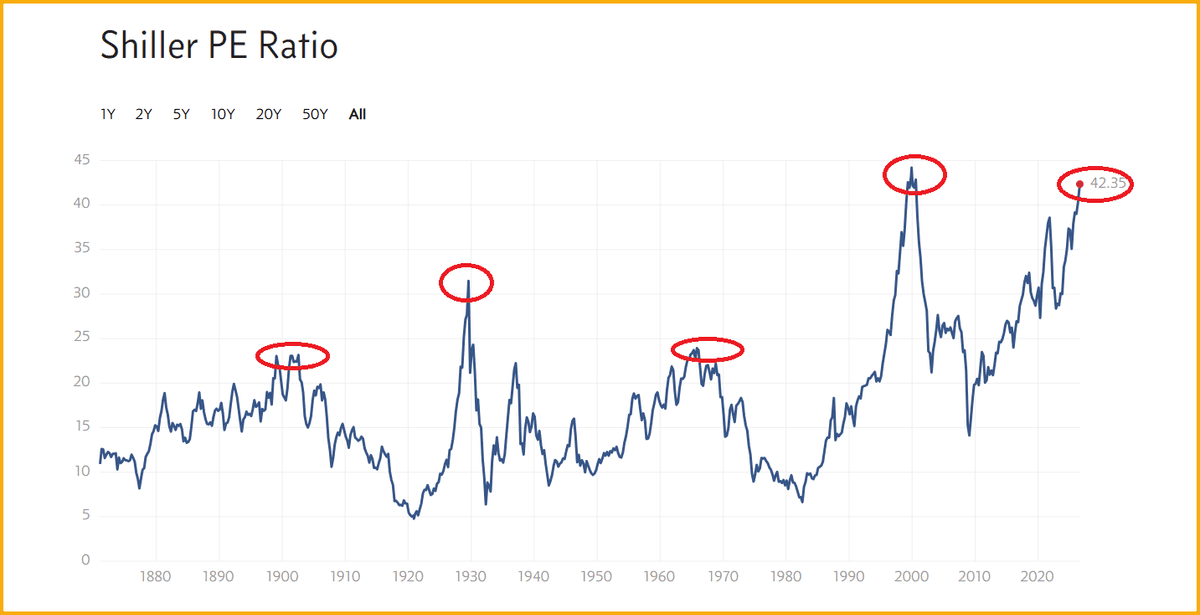
4. Investors who are chasing the price of AI stocks should instead be exhibiting patience; it’s only a matter of time before there’s a major drop that can be bought. Most current buyers will likely be badly underwater by the time that tumble reaches its crescendo.
5. The US government’s $40 trillion debt will almost certainly reach $50 trillion (and ultimately wild printing could take it to $100 trillion) before the house of fiat cards collapses.
6. Rates are on the move again, and not because the debt-themed economy is strong.
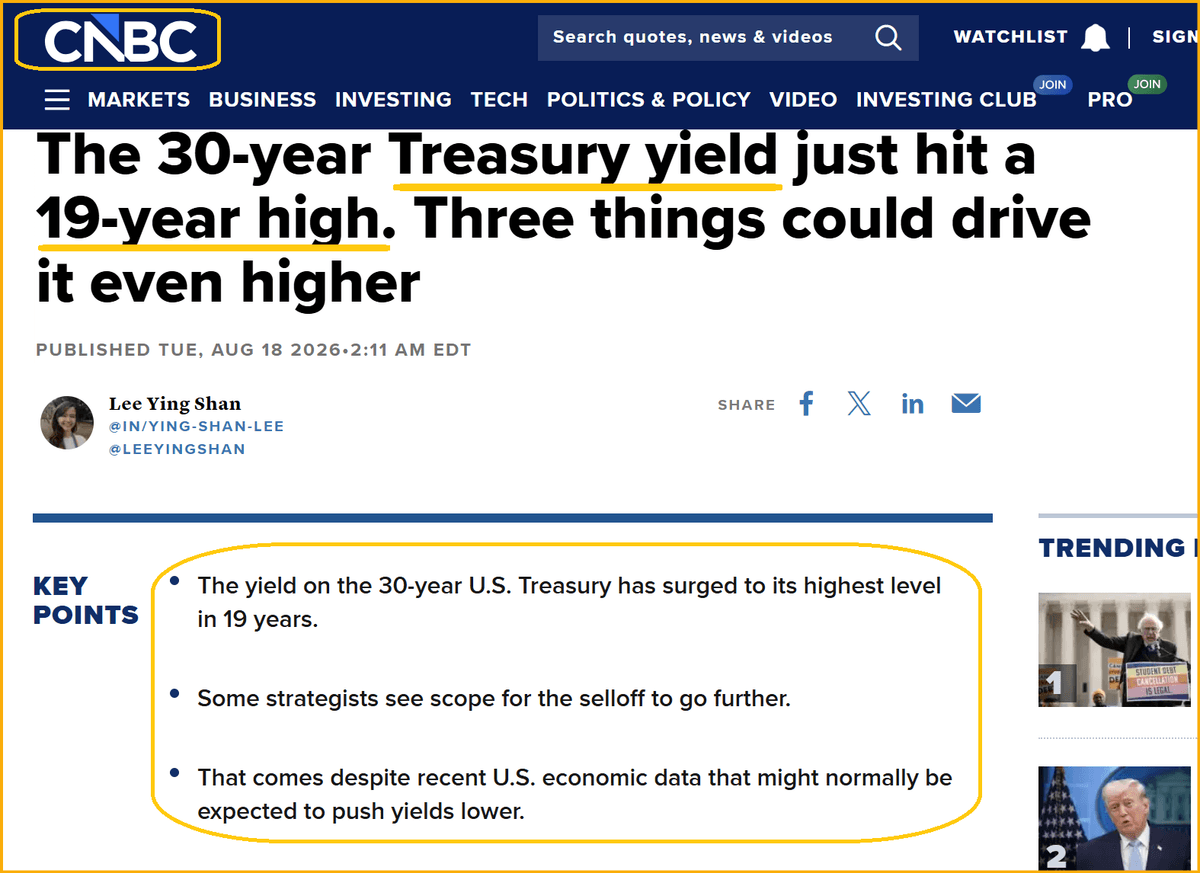
7. The rates currently offered to government bond investors are simply too low to compensate them for the growing risks they are taking.
8. For another view of the interest rate situation. Rates are breaking upside from both a bull triangle and inverse H&S pattern.
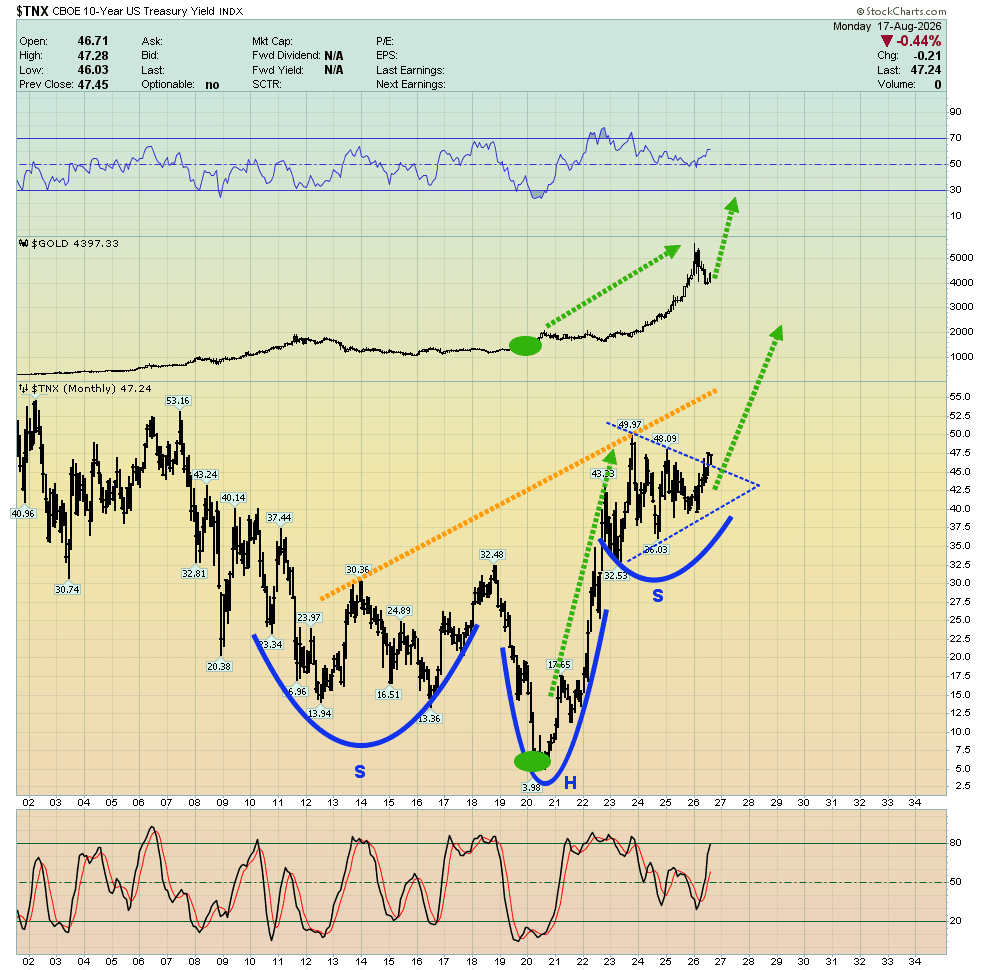
9. The technical target for the next move is 6%. Every percentage move higher in US government bond rates puts more pressure on the false rates-oil-gold narrative because it causes interest costs for the technically bankrupt government to skyrocket.
10. For a long-term view of US rates. Double-click to enlarge what is best described as my death of the US government chart.
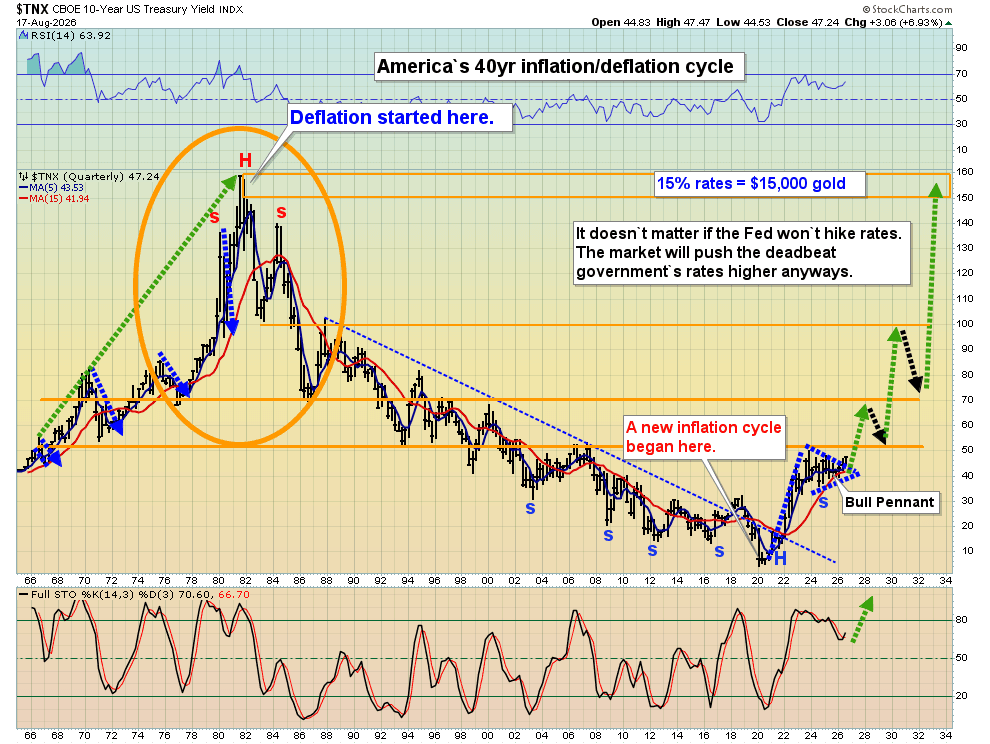
11. It’s only a matter of time before the false narrative implodes and gold, rates, and oil surge together, reflecting the reality of the 40year US stagflation cycle.
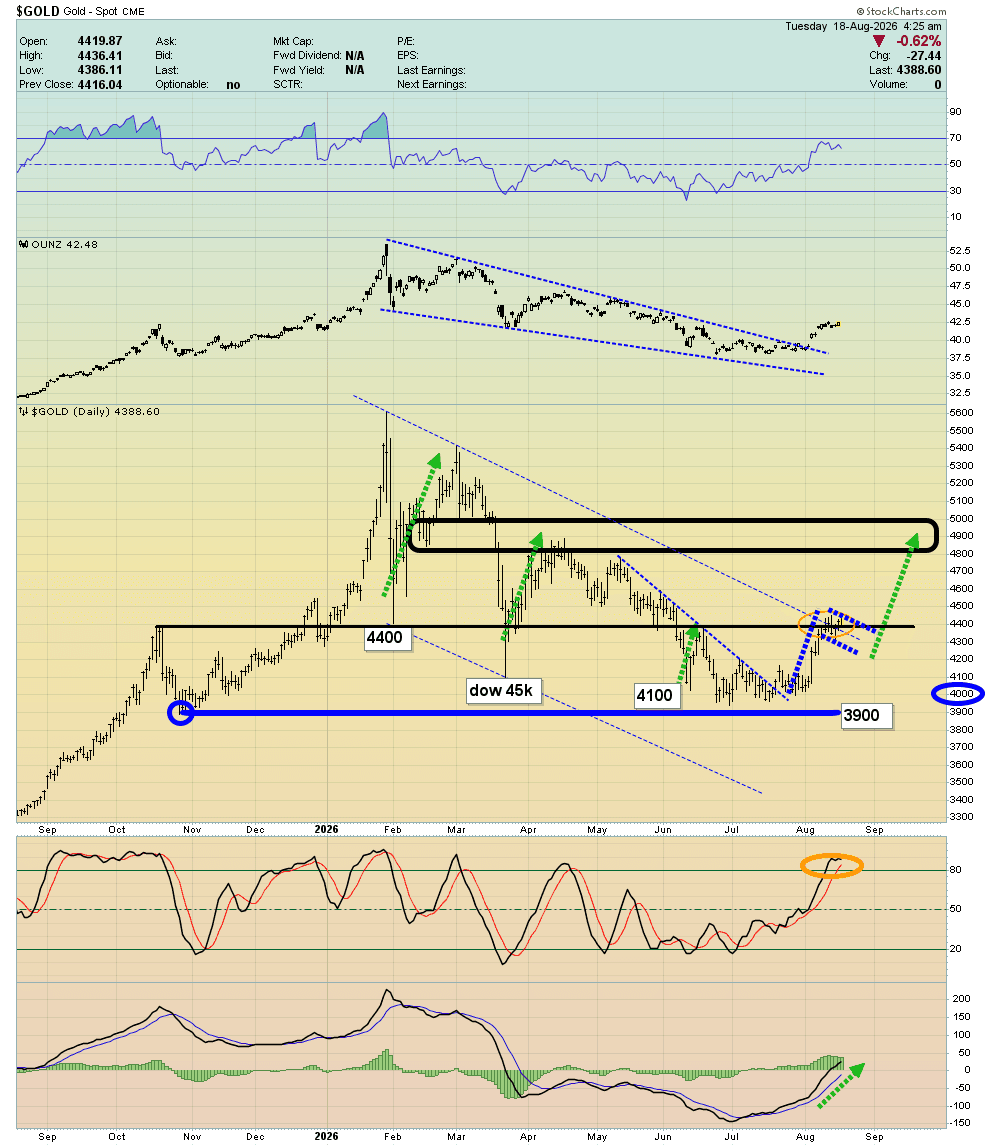
12. All current scenarios favour the bulls. A pullback from here may not happen, but if it does it would likely halt in the $4200-$4100 zone and create a right shoulder for the inverse H&S pattern. The target of that pattern is the $4800-$5000 resistance zone.
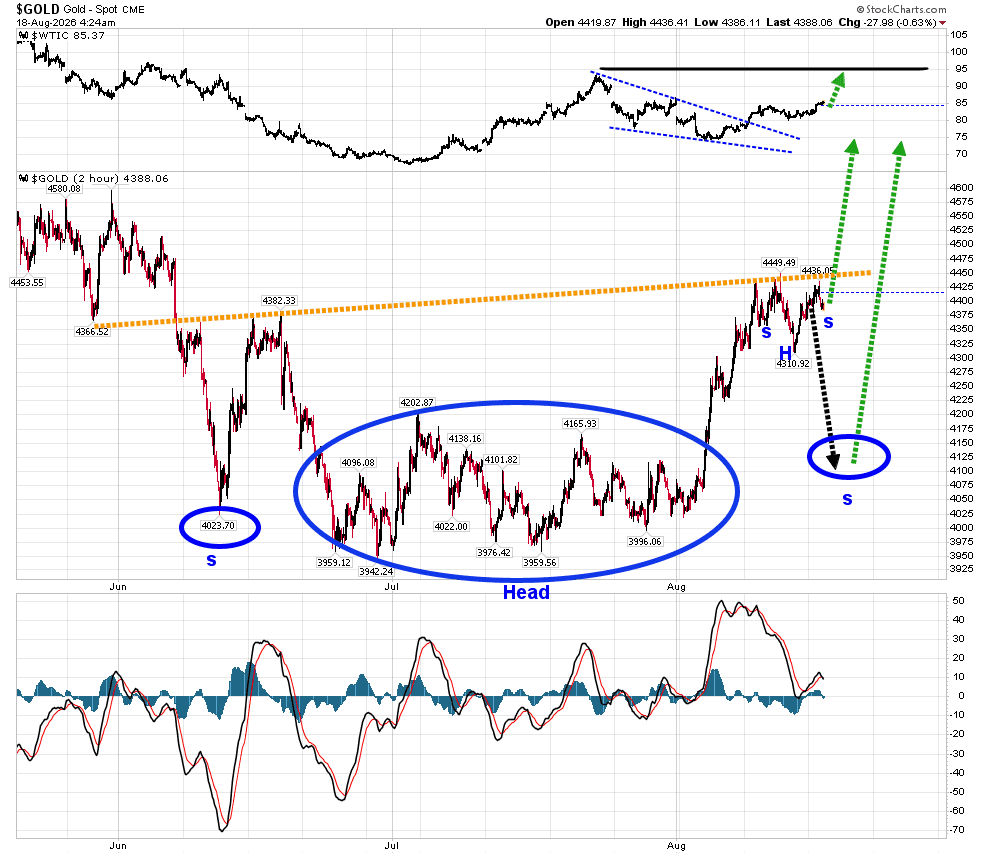
13. For a look at the daily chart. The flag-like drift also targets the same $4800-$5000 area.
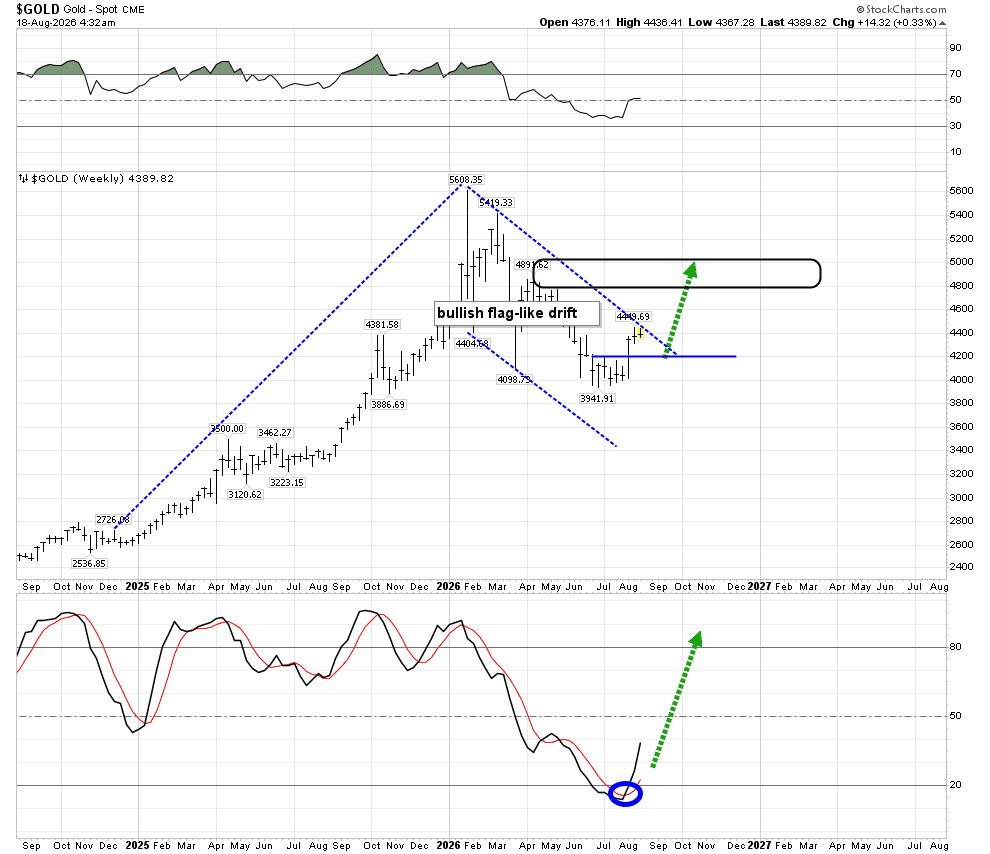
14. On this weekly chart, a much more massive flag-like drift is apparent. It suggests the $4800-$5000 area could function as just a “pitstop”, enroute to at least $8000.
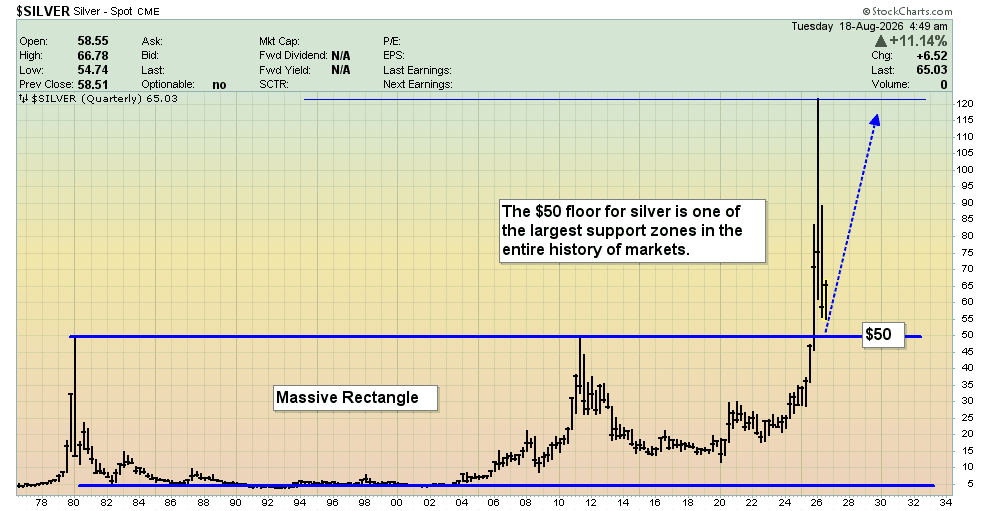
15. What about silver? The new range trade for silver is $50-$120, and from a there a surge to $190-$200 would be the next order of business for this spectacular metal.
16. Sadly, the US government is wasting the precious little time it has left pretending to count and audit its gold… when it should instead be aggressively buying more. There’s almost always a huge opportunity for late-stage empires to get physically smaller and financially bigger… by abandoning their debtor lifestyle and becoming savers focused on gold.
17. In a nutshell, America could become a giant gold-oriented version of Monaco. With a gold or gold-backed currency and no corporate or income taxes and total bank secrecy, millions of businesses would race to move their residency there. Because of its military might and power of the dollar, global governments would have to embrace this approach too, creating a dramatic surge in real freedom for most citizens of the world.
18. While the US government stupidly fails to make this needed move, citizens can do it themselves. Rather than being left to rot in fiat, mining stock profits need to be parlayed into supreme money gold.
19. The CDNX index is a powerful lead indicator of what could lay ahead for all the miners; junior, intermediate, and senior.
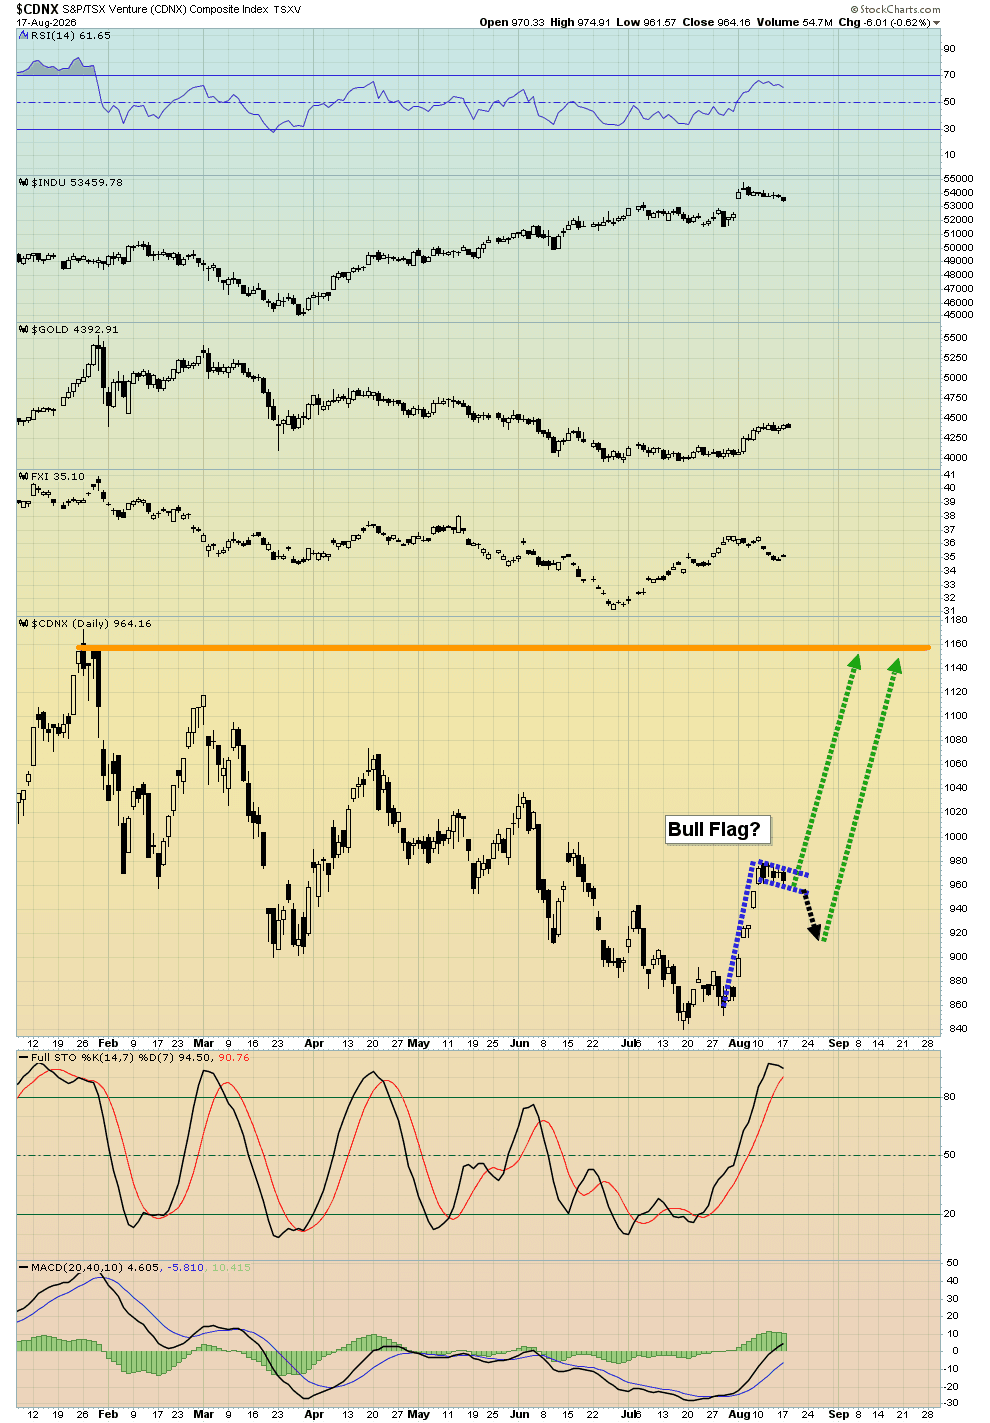
20. This bull flag has a vertical flagpole, which is incredibly positive for future price action.
21. For a look at the long-term CDNX chart. A “rocket launch” event appears imminent, especially given the bull flag action occurring on the daily chart.
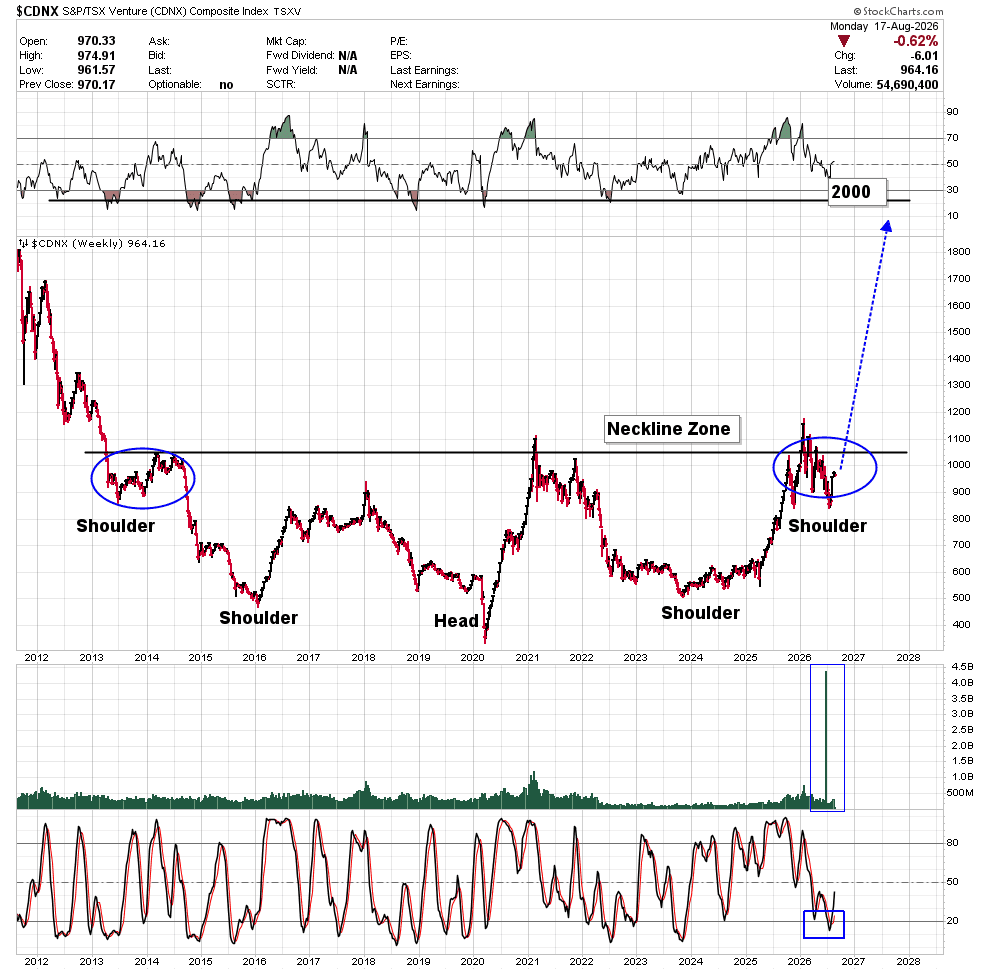
22 Because the price pattern (inverse H&S) is so large, the bull run should see the CDNX rise to well beyond 2000, and probably beyond 3000.
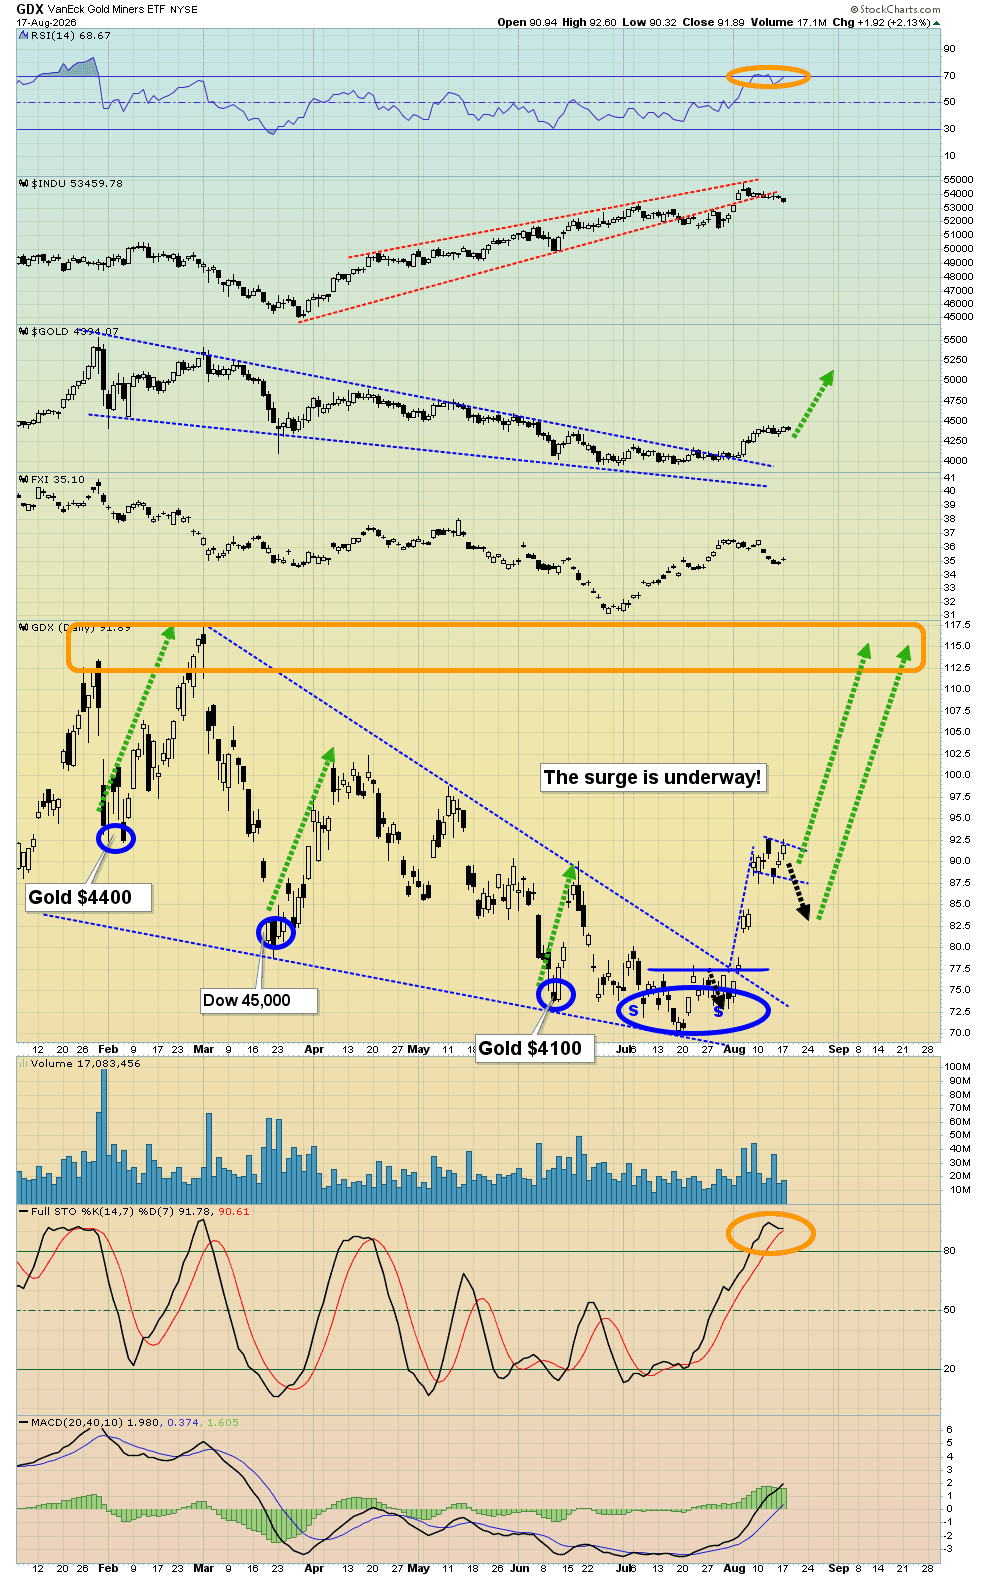
23. Like gold, a flag-like drift is in play, and it targets a move to the $112-$116 area highs.
24. Gold, silver, and mining stock investors are living in one of the most exciting times in the history of markets. The death of fiat, debt, and potentially of government itself are all in play, and the only thing left to say, is have a very golden day!
Thanks!
