
My September 9 read separates trend confirmation from local caution. BTC is testing its next support sequence, ALT breadth is strong but stretched, DXY has confirmed a bearish break, USDJPY is falling, and oil is overdue for a correction after a tension-driven rise.
BTC tests the next support sequence
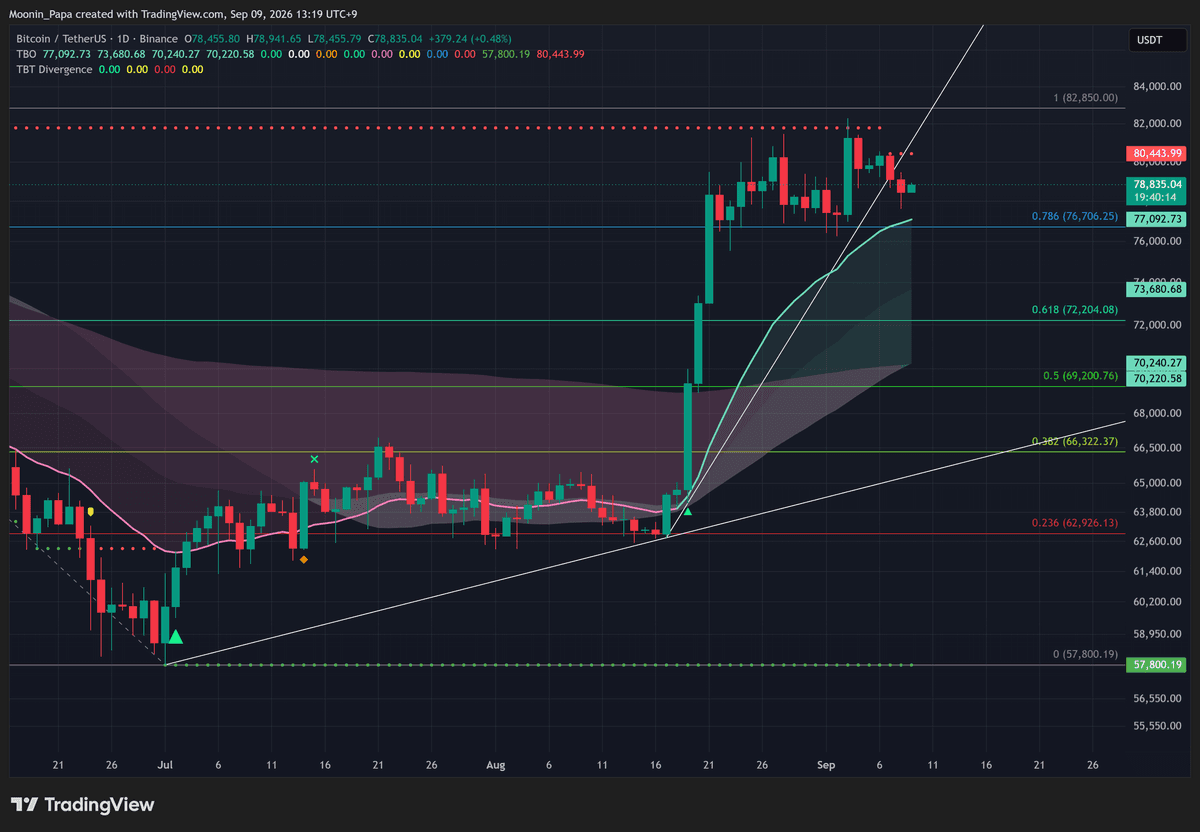
Bitcoin daily Binance chart
BTC lost its first support fan yesterday. I’m watching what happens when price tags the Fast line, with the 0.786 Fib at 76,706 still needing to hold. Tuesday’s OBV cross below its white MA line is technically bearish, but the MA line’s angle remains so strong that considerably more weakness would be needed to turn it down. The two earlier 4h Close Longs closed when price tagged the Fast line, with nothing further since.
OTHERS.D stays strong bullish but stretched
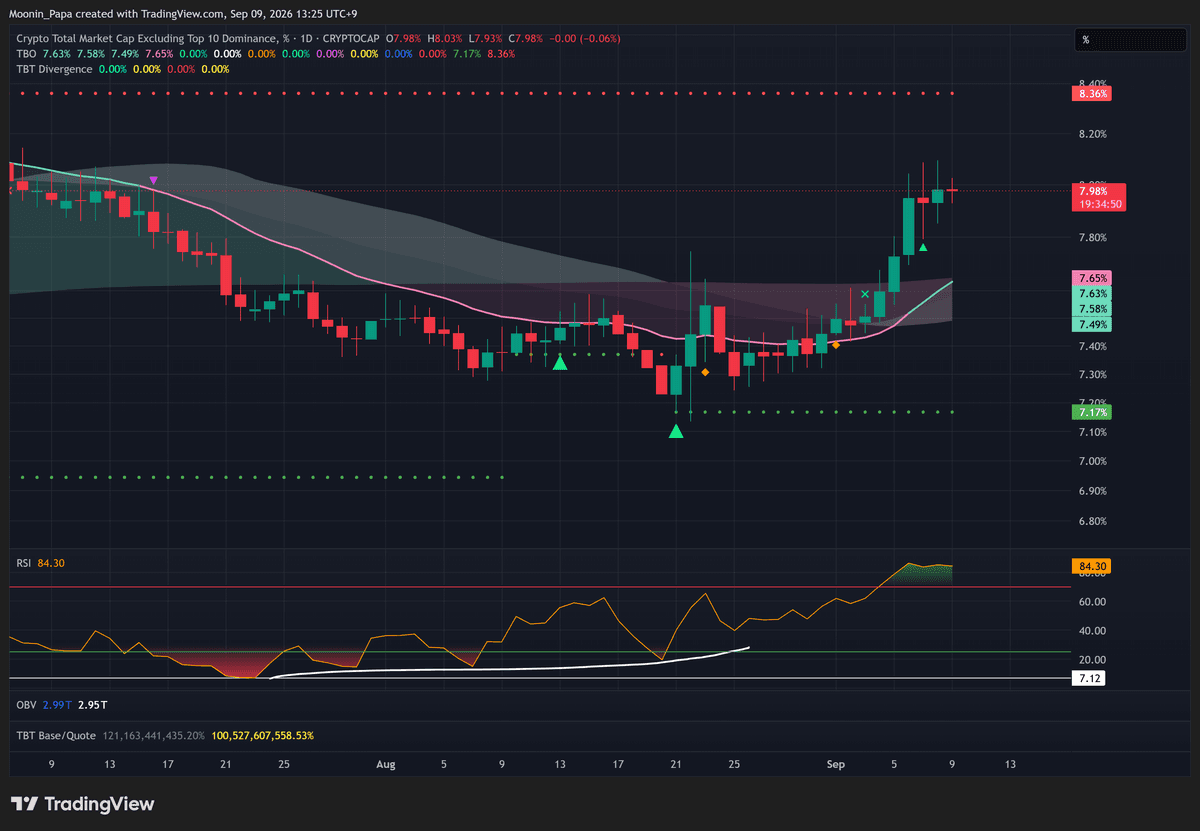
OTHERS dominance daily chart
OTHERS.D remains the strongest dominance chart in this review. RSI has been overbought since Saturday and price is extended from its Fast line, so a pullback is due, but its present state remains strong bullish. Dominance is market share, not spot price.
TOTALE50 market cap confirms a daily Breakout
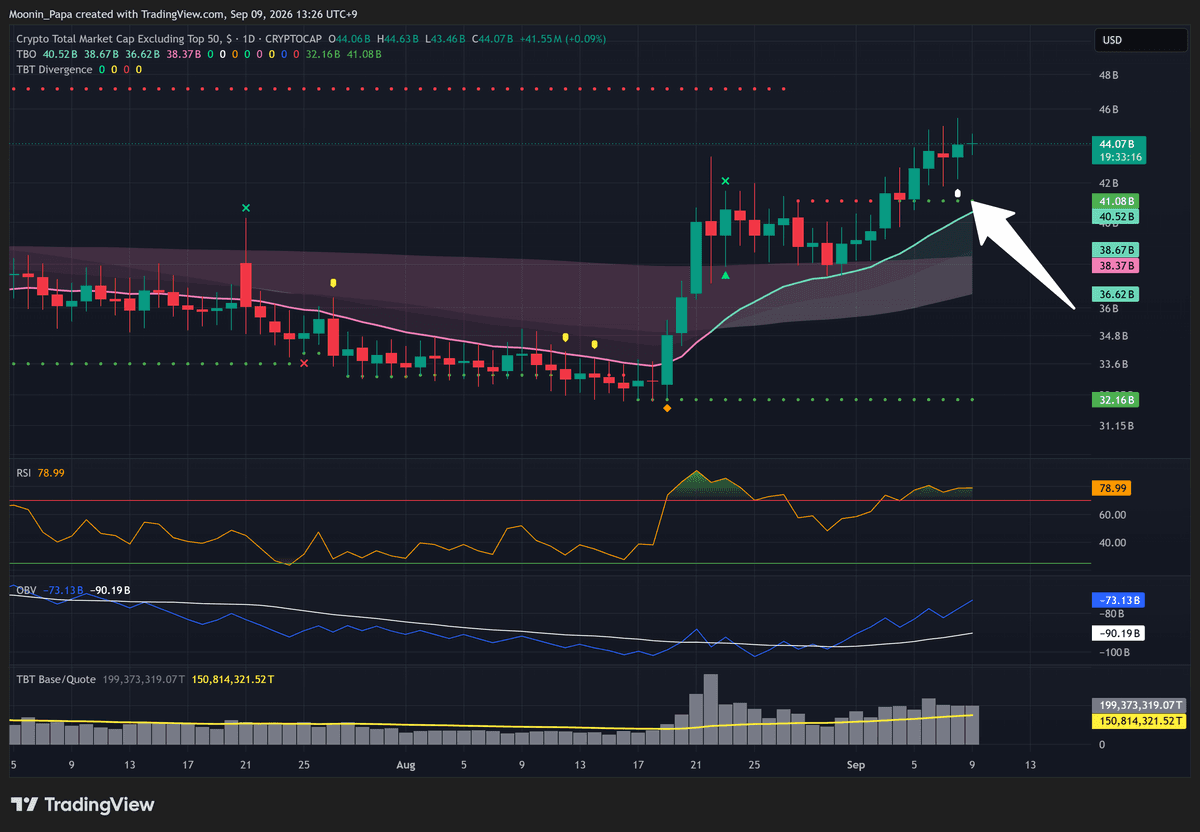
TOTALE50 market-cap daily chart
TOTALE50 market cap printed a Breakout on Tuesday’s daily close. TOTALE100 remains strong bullish on the daily and its OBV is moving higher. These are market-cap states, distinct from the similarly named dominance charts.

DXY confirms a strong bearish trend
DXY daily chart
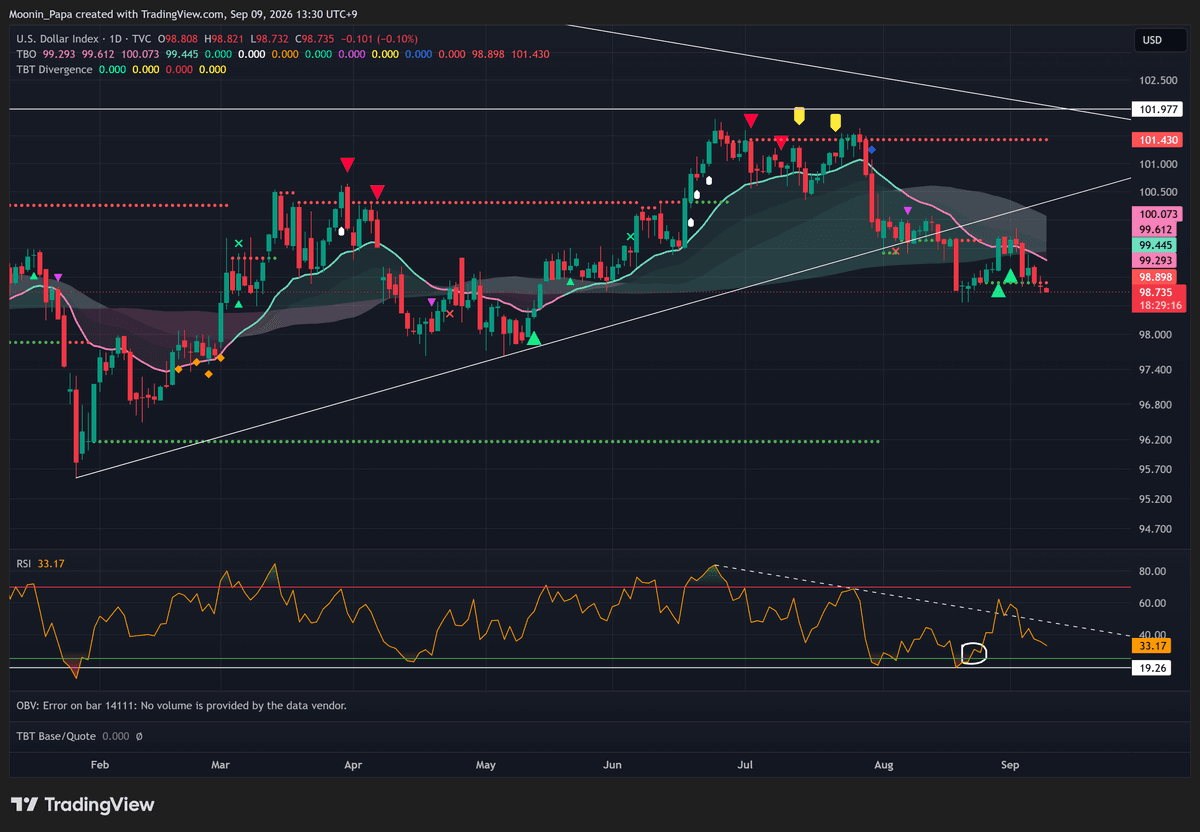
DXY confirmed a close below TBO Support, so its trend is confirmed strong bearish. The falling dollar is helping EURUSD move slightly higher. This is an already-confirmed state, not a future trigger.
USDJPY falls toward 152.092
USDJPY daily FXCM chart
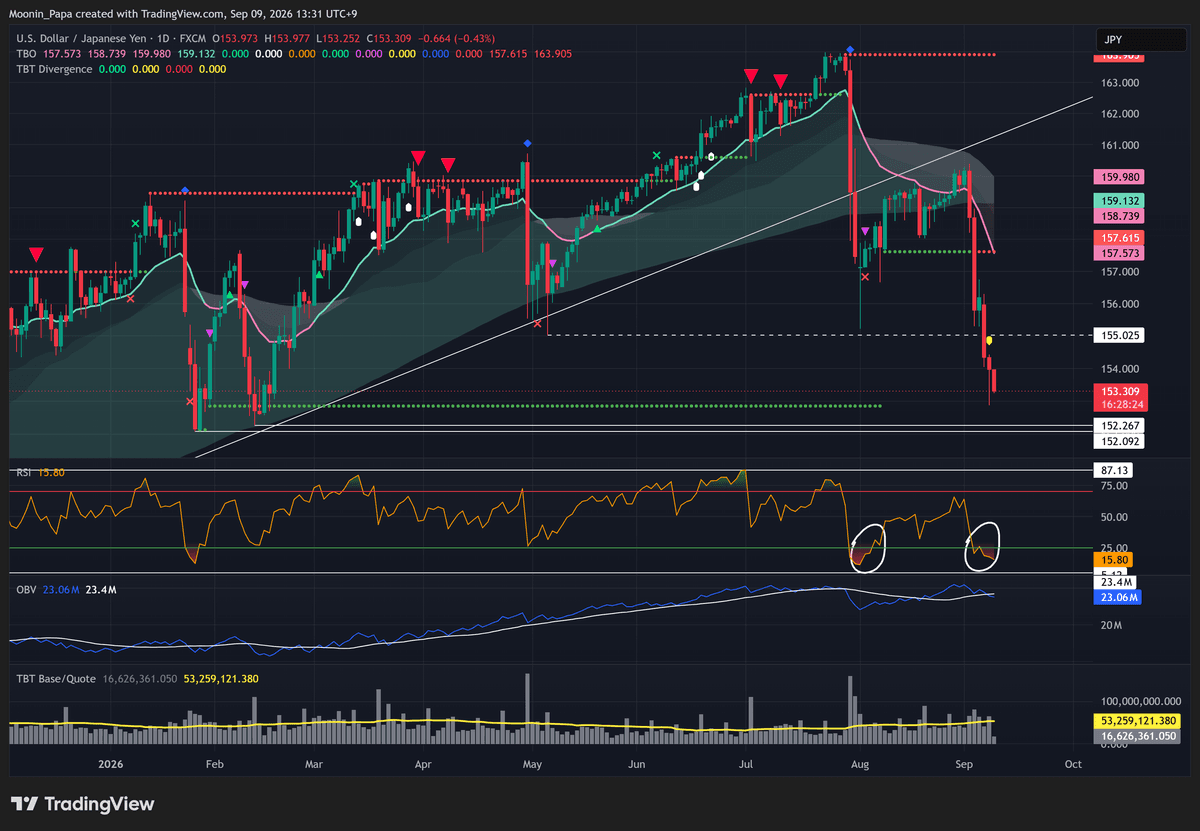
USDJPY is falling, and the next low that needs to be taken out is 152.092. This is where I see the most action in TradFi right now.
Oil rises into a fifth overbought day
Light crude oil futures daily chart
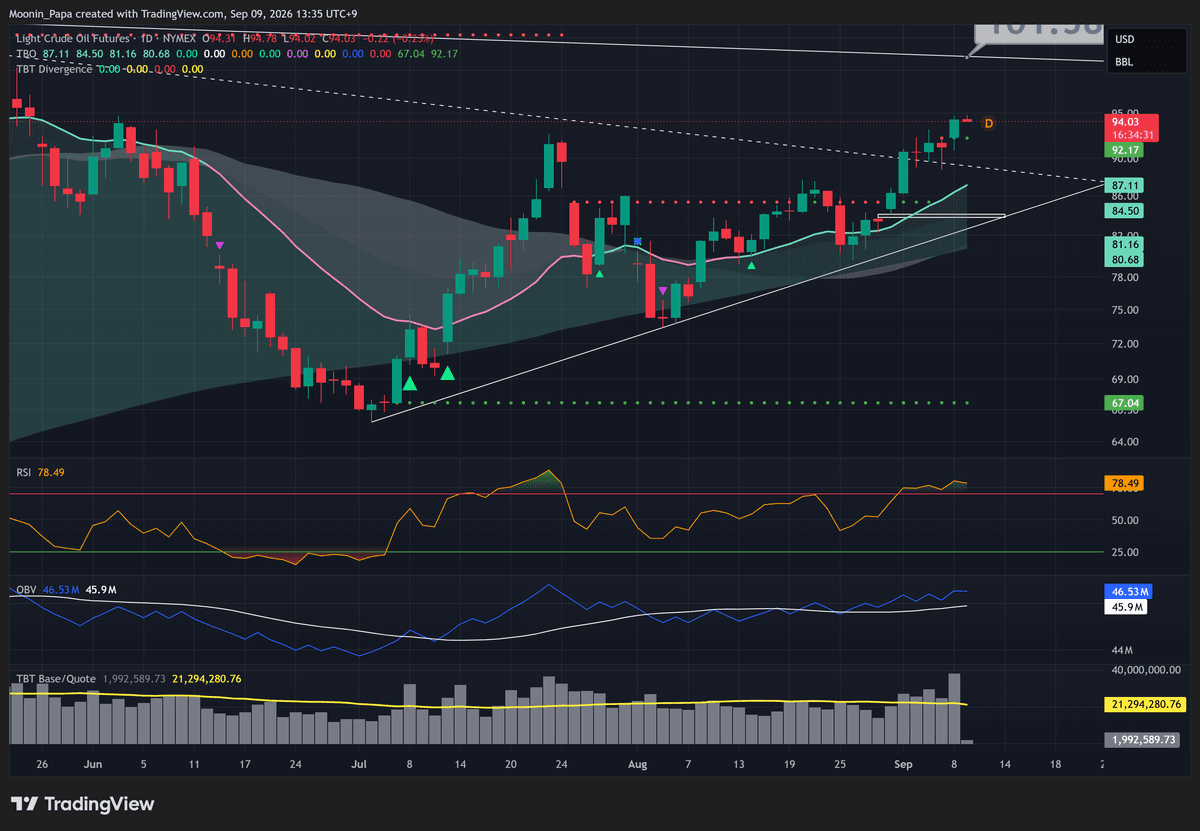
Oil futures pushed up 3% because of Middle East tensions. At the same time, RSI has now logged five confirmed overbought days, leaving the market even more overdue for a correction.
Learn my strategies and the tools I use every day by visiting The Complete Cryptocurrency Investor by Mastering Assets.
