

My October 2, 2026 read separates Bitcoin’s unconfirmed resistance close from the confirmed dollar breakout, while keeping mixed altcoin and equity signals attached to their own charts.
Bitcoin tests resistance without a confirmed close
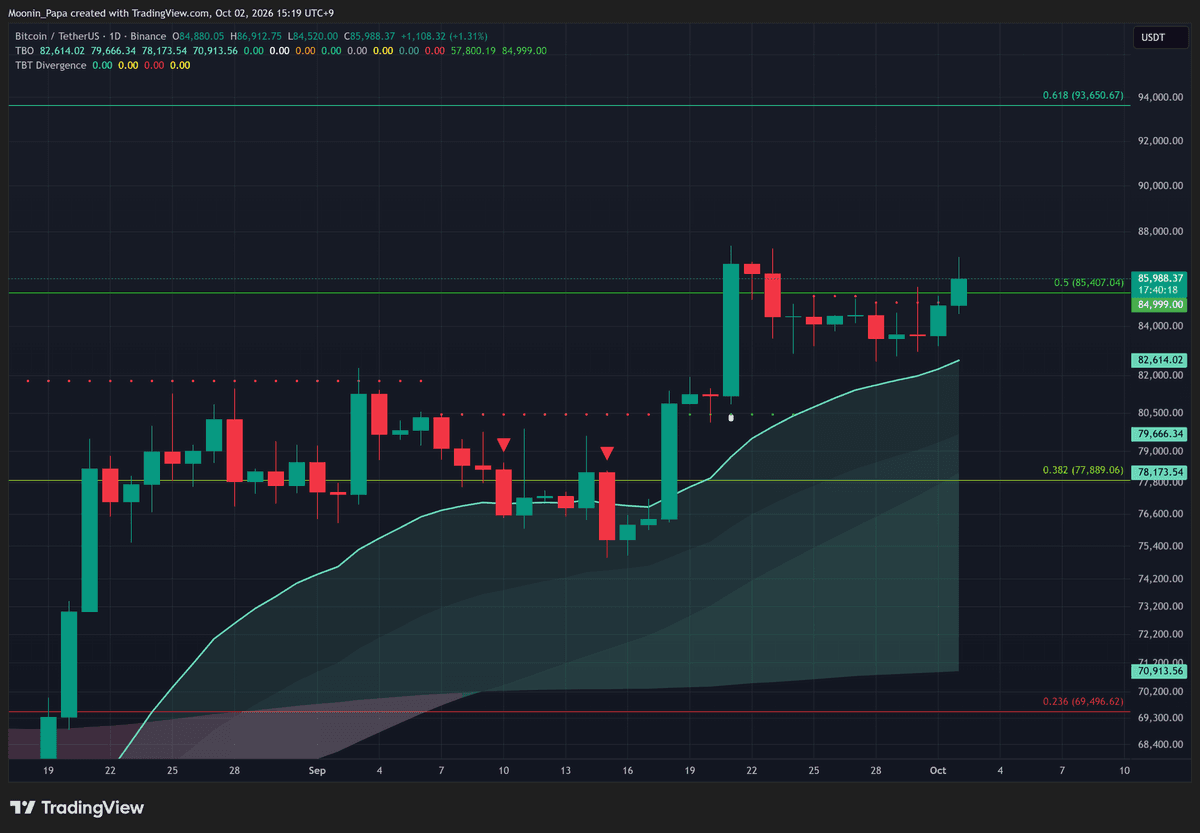
Bitcoin / TetherUS · 1D · Binance
BTC pushed above the 0.5 Fib level and is now trading above TBO Resistance, but the daily close above that resistance is not confirmed. If BTC closes above it, that is a strong momentum signal that could carry price to the 0.618 Fib level at $93,650. I personally do not expect that outcome, though the chart is strong enough that I will not dismiss it.
Altcoin dominance warnings are real but weak
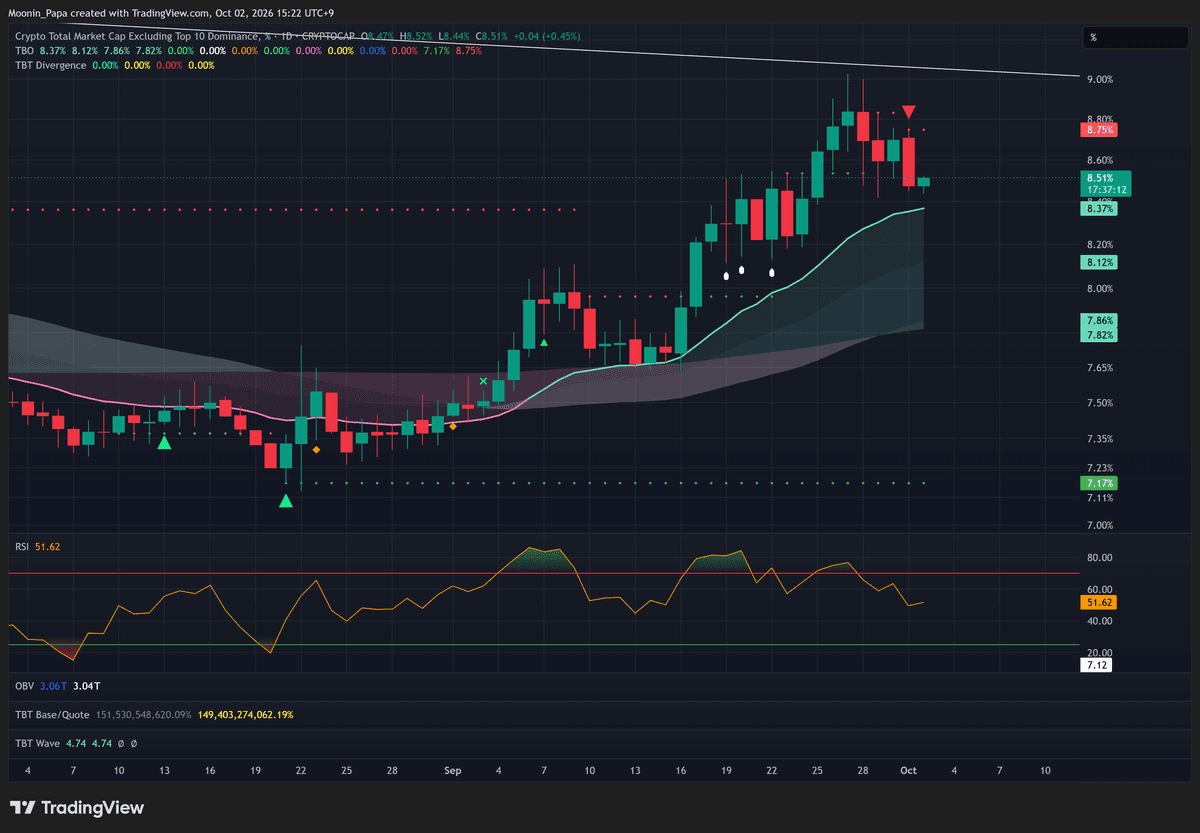
Crypto Total Market Cap Excluding Top 10 Dominance, % · 1D · CRYPTOCAP
OTHERS.D printed a TBT Bearish Divergence as BTC dominance rose. The warning remains real, but its rising TBO Slow line conflicts with the divergence and makes the pullback signal weak rather than severe. OTHERS.D is market share, not spot price. Separate dollar market-cap charts such as TOTALE50, TOTALE100 and OTHERS remain strong bullish even while dominance charts show short-term rotation pressure.
A second ten-day warning meets a springboard setup
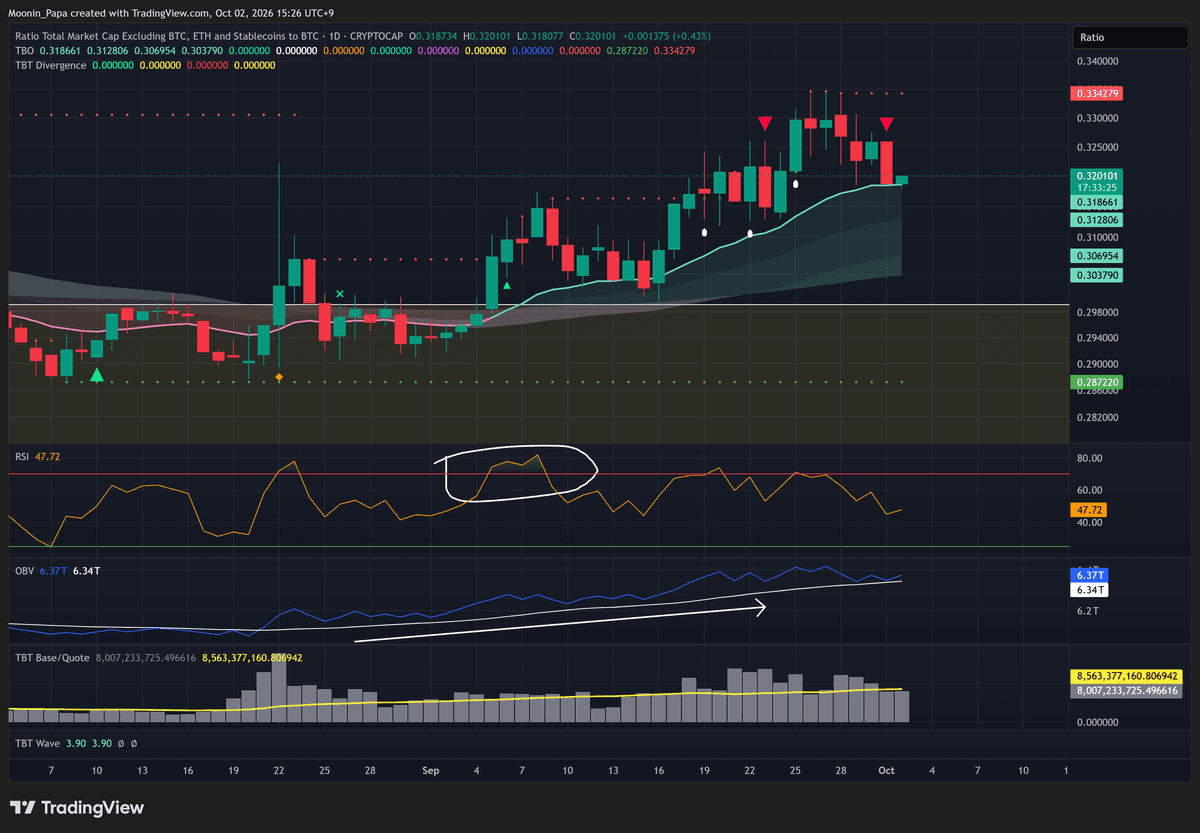
Ratio Total Market Cap Excluding BTC, ETH and Stablecoins to BTC · 1D · CRYPTOCAP
TOTAL3ESBTC printed its second TBT Bearish Divergence in ten days. Its rising Slow line partly offsets the signal, but a second warning in that window should not be ignored. At the same time, the chart is giving a perfect TBO Springboard Bounce setup, leaving short-term pullback risk and a constructive setup on the same chart.

The dollar breakout is confirmed; exhaustion is a theory
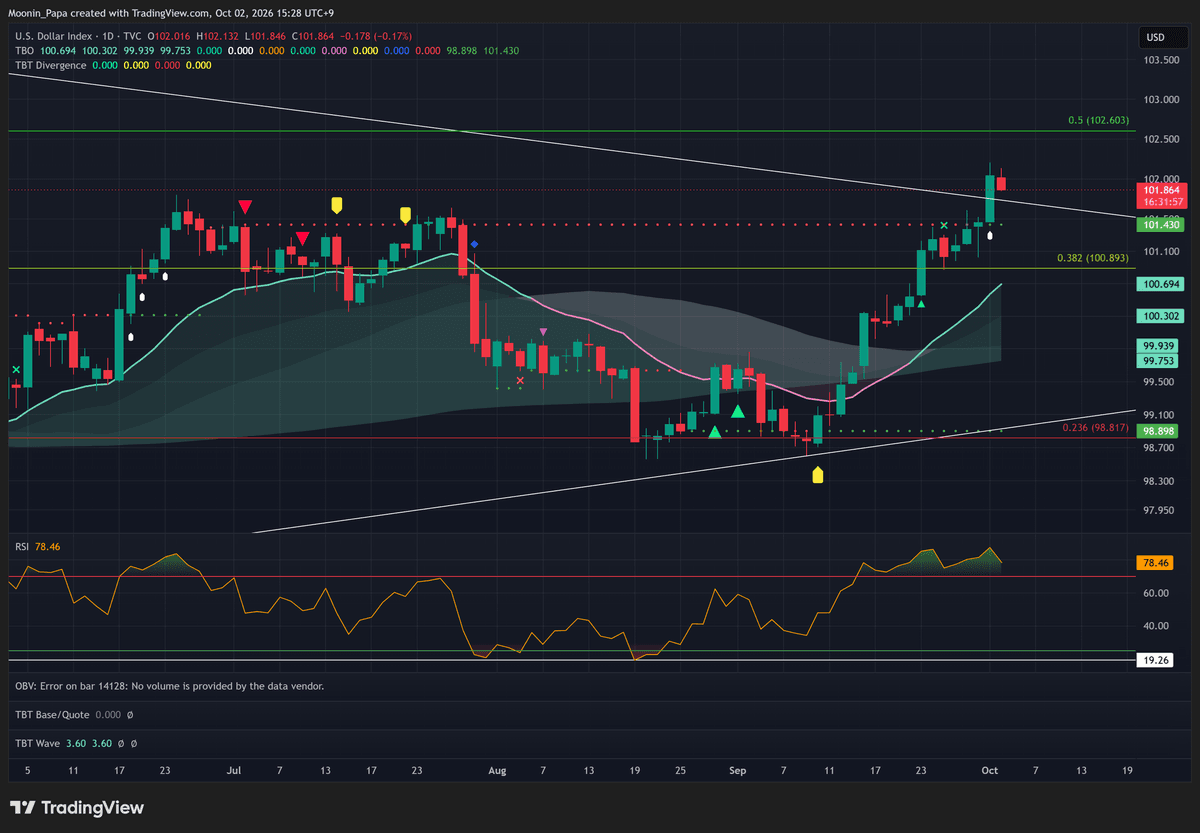
U.S. Dollar Index · 1D · TVC
DXY moved above long-term overhead resistance and printed a TBO Breakout, its highest level since April 2025. That breakout is confirmed and the damage has been done. I think it looks more like an exhaustion breakout than continuation, and I am sticking with the theory that a weekly overbought RSI pattern may mark a top, even though that view is speculative and conflicts with how I normally use weekly RSI.
TradFi remains divided rather than collapsing
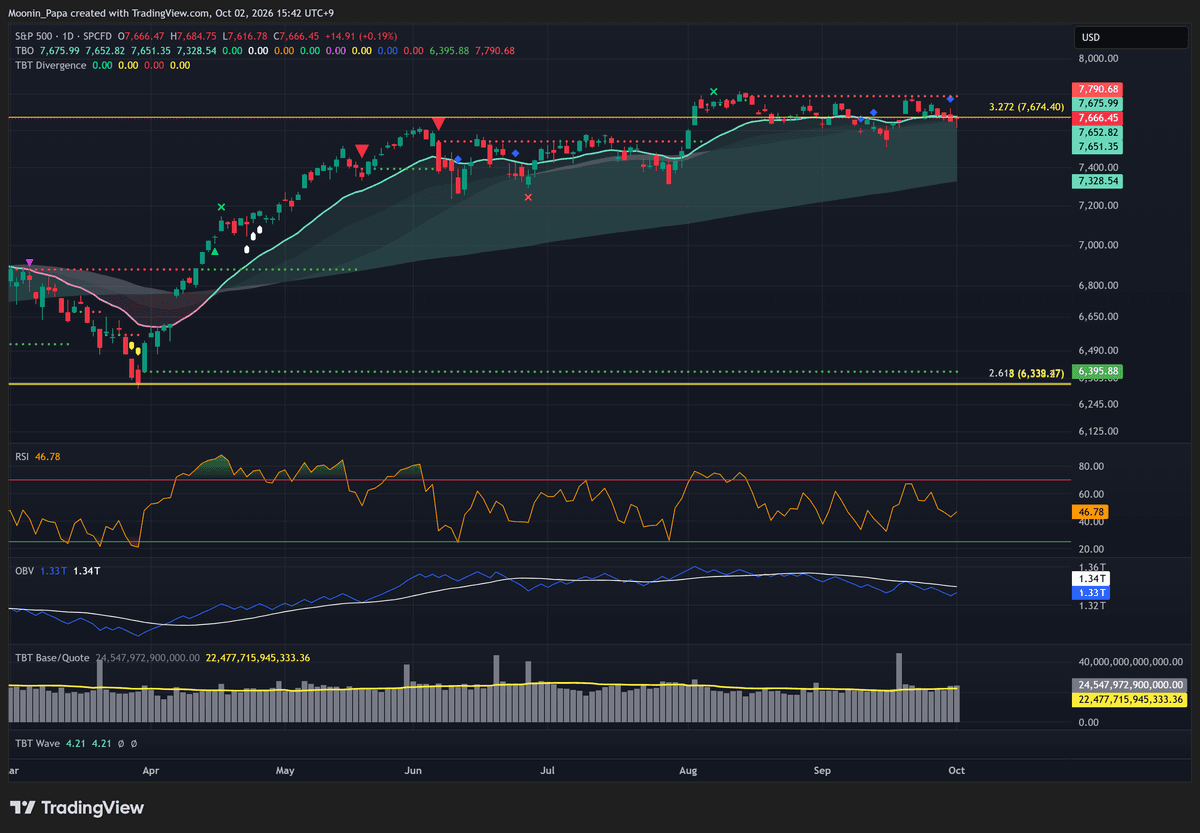
S&P 500 · 1D · SPCFD
S&P futures remain firm, while the SPX spot chart closed Wednesday’s TBO Close Long and remains macro bullish with the TBO. NDX is strong bullish above the Cloud, but DJI could fall into strong bearish mode and Russell 2000 already remains strong bearish below its Cloud. The evidence is conflicted, not a broad equity crash.
Divergence strength depends on the Slow line and cluster
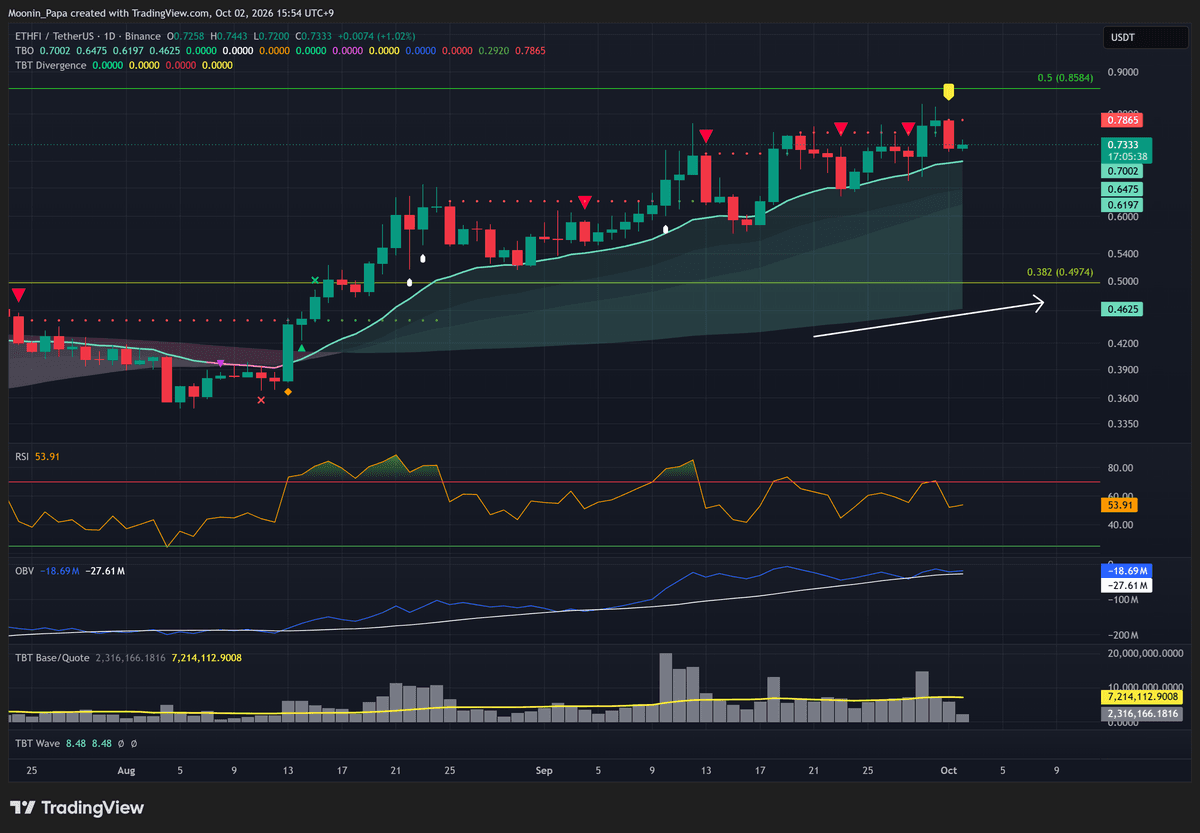
ETHFI / TetherUS · 1D · Binance
ETHFI printed a TBT Bearish Divergence Cluster. Its Slow line is rising, but the Cluster makes this warning a bigger deal. That is stronger than the ordinary PYTH and RAY divergences whose bullish Slow lines reduce concern, while DOT’s descending Slow line reinforces its separate bearish divergence. These states belong to each asset and should not be flattened into one altcoin signal.
Learn my strategies and the tools I use every day by visiting The Complete Cryptocurrency Investor by Mastering Assets.
