

My September 4 read separates confirmed trend states from exhaustion warnings: BTC has a daily bearish divergence inside a strong bullish weekly trend, lower-cap market-cap charts improved, USDJPY still lacks its decisive break, oil is overbought, indices are bouncing, and ALT signals remain asset-specific.
BTC prints daily bearish divergence at resistance
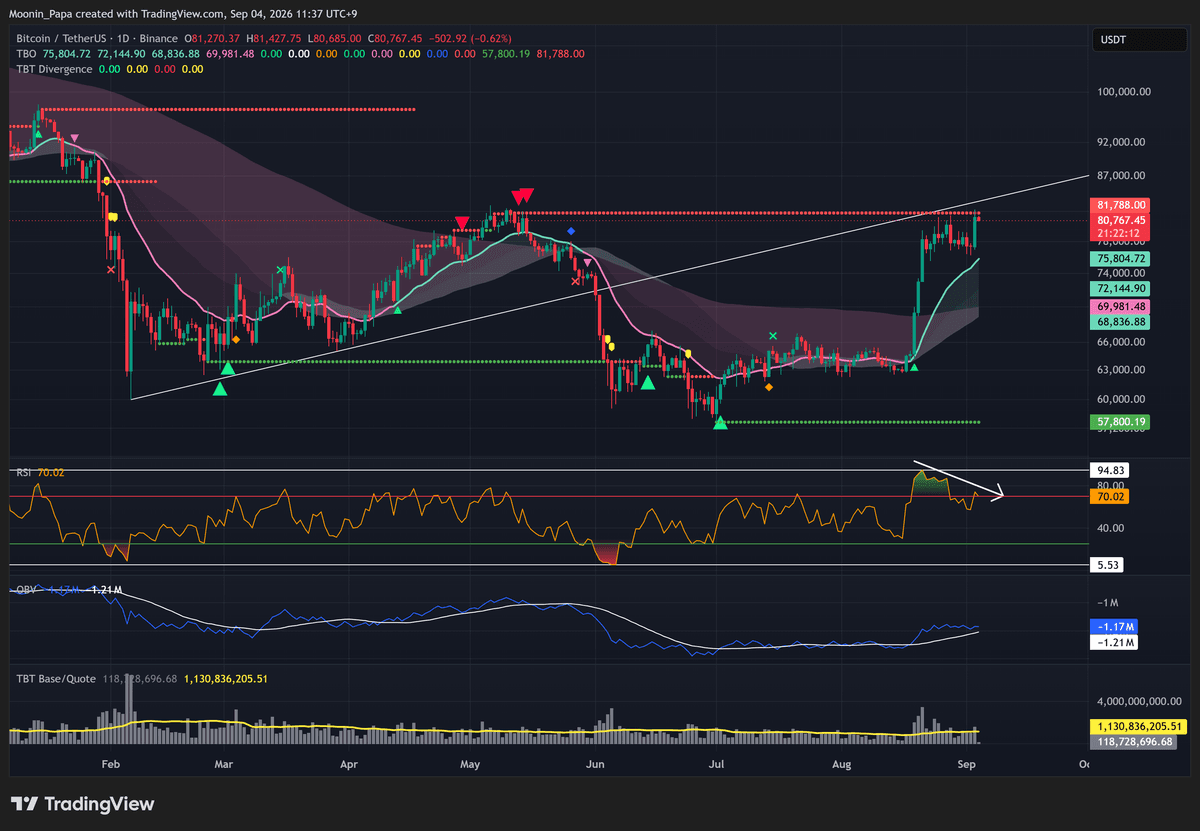
Bitcoin TetherUS daily Binance chart
I saw BTC reach TBO Resistance at $81,788 and wick above it on Thursday without tagging the historical support that can define the bear-flag channel low. Price made a higher high while daily RSI made a lower high, so I see a bearish pullback setup. I keep the timeframe split intact: the weekly chart remains strong bullish with RSI rising to 74.25.
OTHERS closes above resistance while dominance remains separate
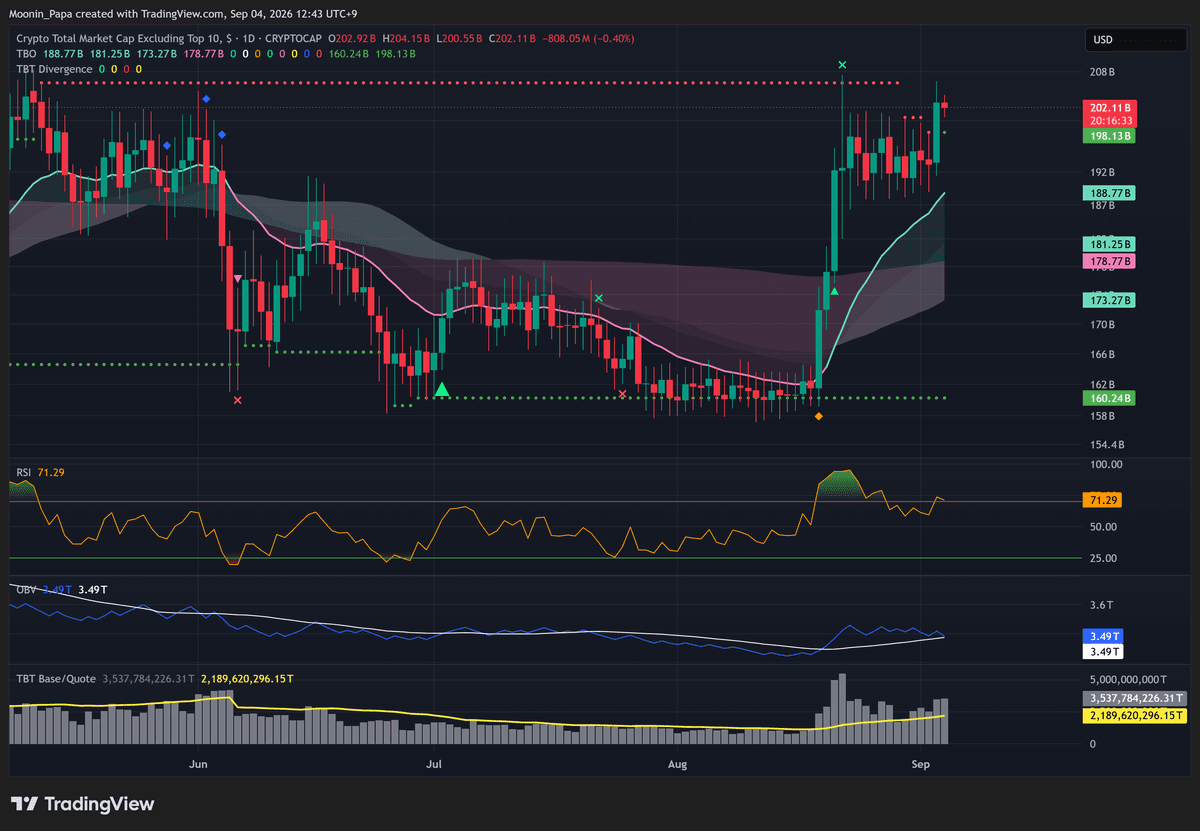
OTHERS daily CRYPTOCAP market-cap chart
I see OTHERS market cap excluding the top 10 close above TBO Resistance, exactly what I wanted to see for ALTs. TOTALE50 separately confirmed a strong uptrend, while TOTALE100 only closed above its Cloud and did not clear resistance. OTHERS.D is a different dominance chart and merely closed green. Dominance is market share, not spot price. I also treat the 5% TOTALES breakout as fishy exhaustion rather than continuation.
USDJPY still has not broken 155.025
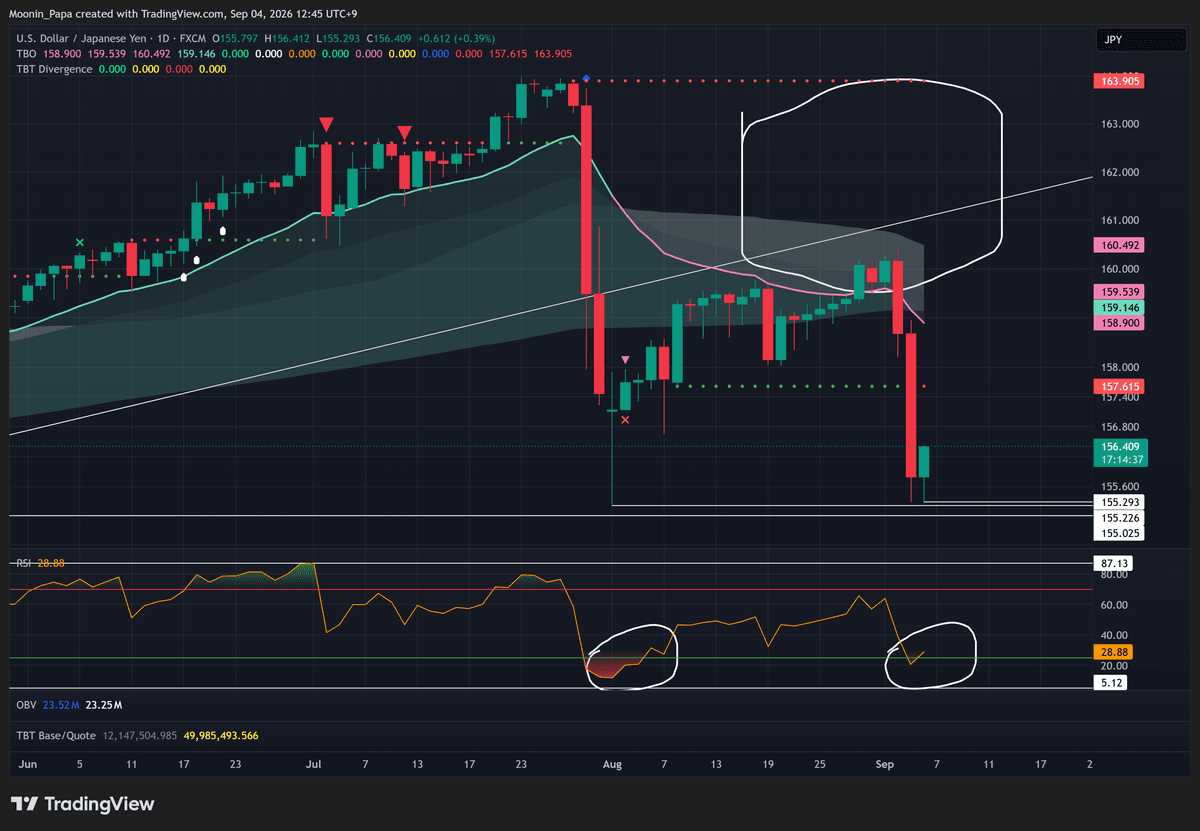
U.S. Dollar Japanese Yen daily FXCM chart
I saw USDJPY dump, but it remained short-term oversold, did not break below 155.025 and is already bouncing today. I still believe nothing serious happens until 155.025 breaks, so I preserve that exact trigger instead of treating the bearish move as confirmed.

Oil is overbought with an unconfirmed weekend-drop thesis
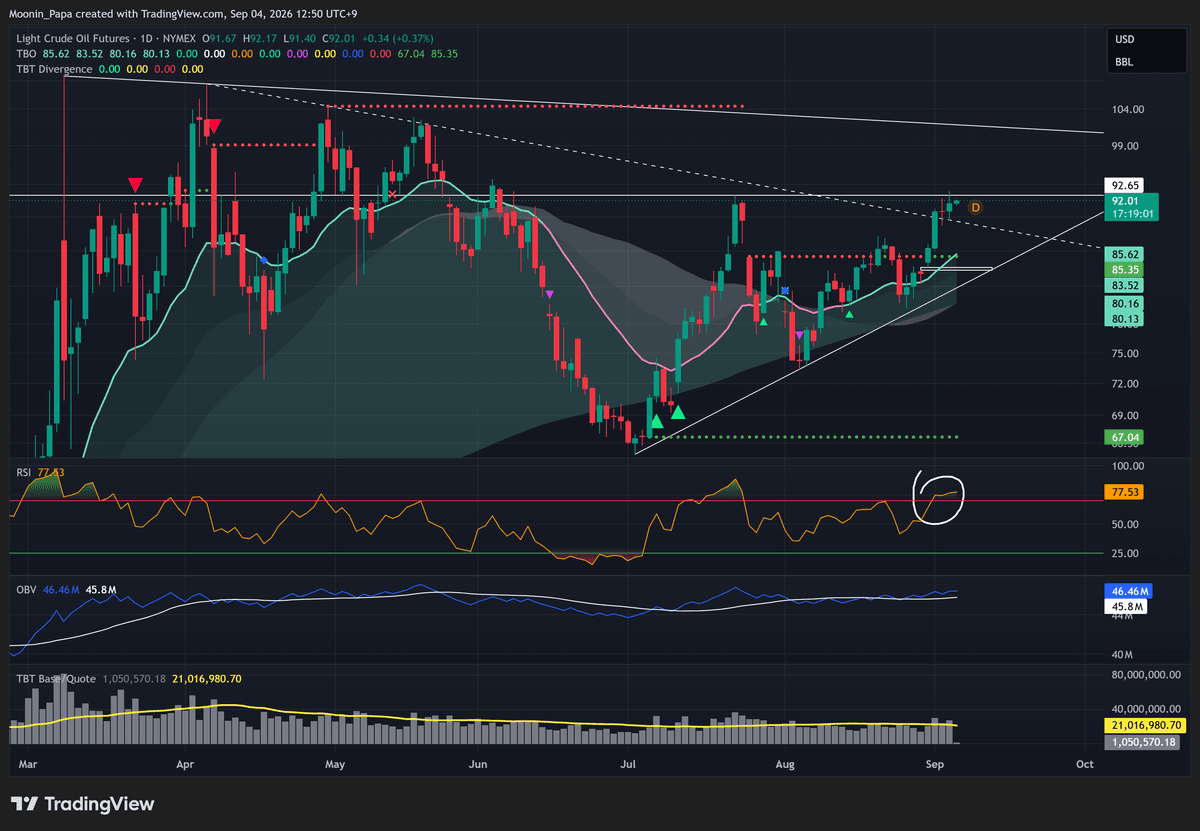
Light crude oil futures daily NYMEX chart
I see oil futures put in a slightly higher high on Thursday while remaining overbought. I have a funny feeling it drops by or during the weekend, but that is a thesis rather than a confirmed reversal. I gave no entry, stop or target, and I do not invent one.
Major indices bounce back above the Cloud
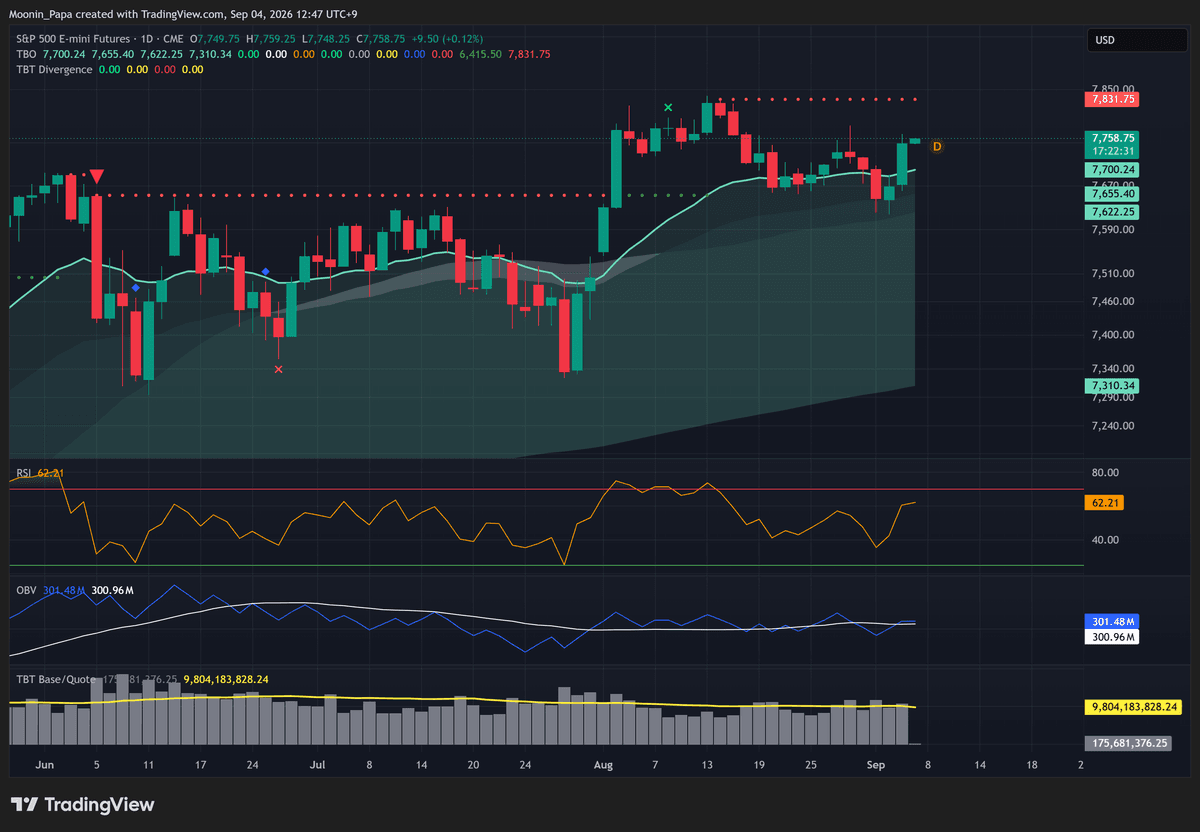
S&P 500 E-mini futures daily CME Mini chart
I see S&P futures back above the Cloud after all major indices bounced on Thursday, and I expect that bounce to continue. I keep the stock-level qualifiers separate: NVDA is still below TBO Resistance at 231.50, while TSLA reached the top of its Cloud, closed the July 22 gap and opened a new gap immediately below.
FET confirms while other ALT states stay distinct
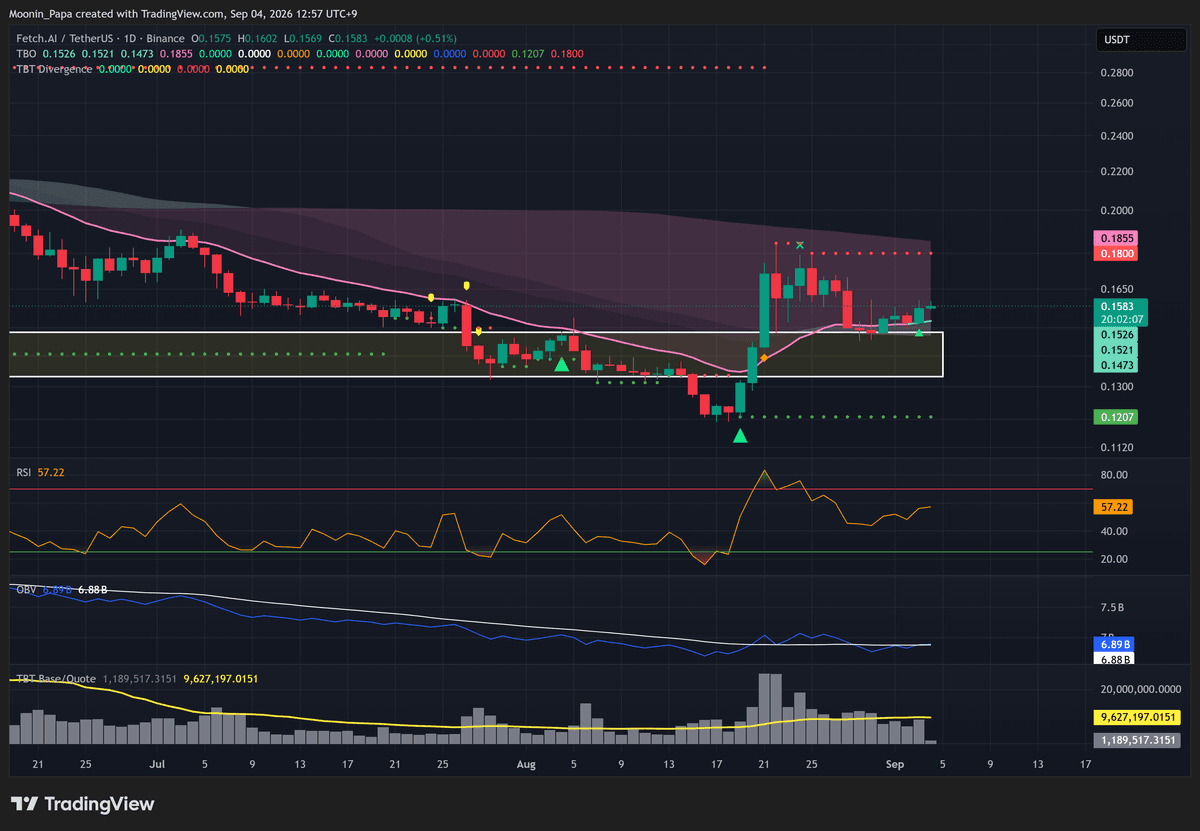
Fetch AI TetherUS daily Binance chart
I see FET finally confirm an Open Long. XRP separately completed a TBO Springboard Bounce into resistance, and LDO confirmed its own Springboard Bounce. DASH only has a breakout in progress, SYRUP is heading into strong bullish territory, and KMNO remains a long way from TBO Resistance. I do not flatten those different states into one blanket ALT call.
Learn my strategies and the tools I use every day by visiting The Complete Cryptocurrency Investor by Mastering Assets.
