
The gold stock correction has dragged on for all of 2026, and it is finally maturing
Indeed, the correction likely already ended back in July. But the decline from the hopeful summer rally does not feel that way. Let’s take a quick technical look and then cover a few fundamental considerations.
HUI (daily) Technical
The blue Fibonacci retrace grid on the HUI daily chart is measured from the December, 2024 low (not visible on this chart) and the orange Fib grid is measured from the low made this summer.
Huey has retraced 38% of the major long-term rally out of 2024 and 62% of the summer rally. It’s also still in a downtrend channel, but losing another support area.
However, this is the volatile gold stock sector and as you will see below, and as we’ve been noting in NFTRH for months now, the macro-fundamentals are not good. Not yet.
So it is entirely possible, if not probable that HUI will visit the 50% retrace area per the blue grid. That would put in a solid bottom retest of the summer low. As a side note, HUI does not show price gaps, but a chart of GDX does. GDX has open gaps all the way down to what would be a summer retest area.
Meanwhile, could HUI bounce from the channel bottom to the channel top? Sure could. What better way to punish those jumping on short? But the situation is still firmly in correction until it either makes a good downside low and reversal or breaks the conjestion of the channel top, the 200 day moving average and associated resistance all in the 760-770 range.

Gold Stock Fundamentals
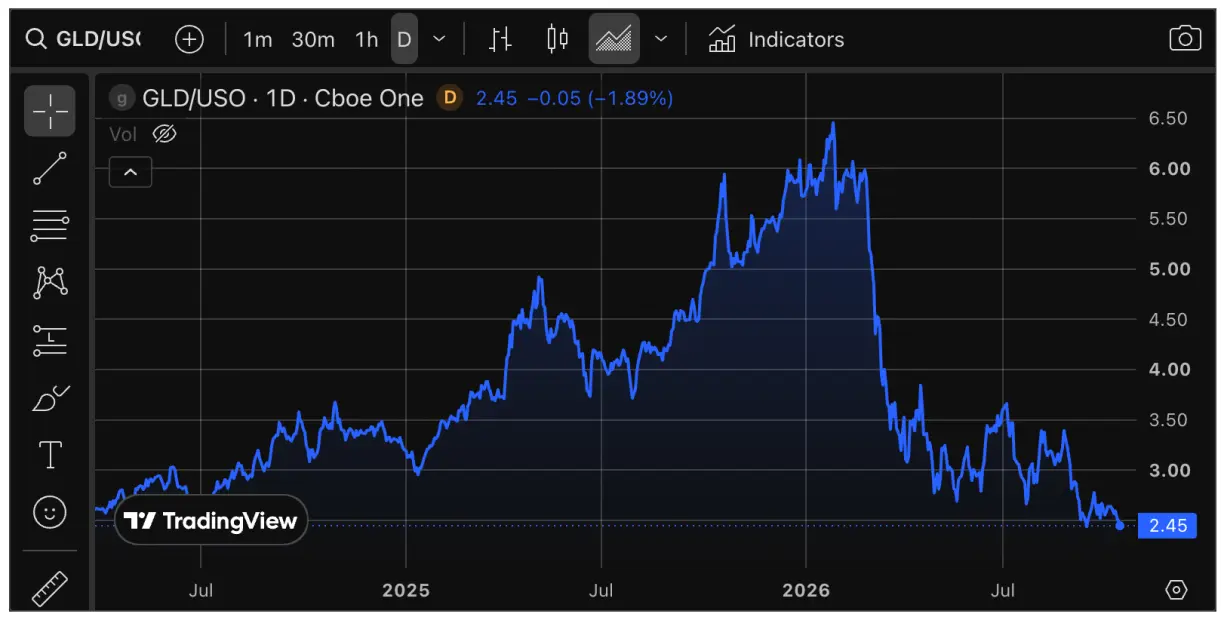
You need look no further than this chart of the gold mining product in relation to a major mining cost input to see that the current situation is not good. No belly aching that it’s the war, it’s Trump, it’s this or that. The fact is that the Gold/Oil ratio (GOR) is currently quite bearish. Gold stocks are no doubt in the process of discounting this now.
The GOR (in this case, GLD/USO) is hitting new lows. So is this leg of the gold stock correction. Logic is a good thing, because when this turns to the upside it will be an even better thing. I expect GOR to recover strongly in 2027, if not sooner.

I have made a big deal about the Bessent/Warsh yield curve… let’s call it “management”, over the last couple months, beginning in August: Operation Twist 2.0? Bessent & Warsh Work the Yield Curve.
Well, after the hype of runaway Treasury yields…

…we may finally have our Goldilocks curve flattener as long-term bonds find relief and the Fed remains firm on the Funds rate, pressuring the short end.
All part of the plan in my opinion. It is also expected to be a temporary thing, engineered as it was prior to the mid-term elections. A Goldilocks ‘flattener’ is usually not particularly gold-friendly.

The “real” 10yr Treasury yield has combined with the hawkish Fed to double whammy gold, which has actually held up better than one might expect during such a troublesome macro, ginned up though it may be.

This has instigated a base breakout in the US dollar index. However, Uncle Buck is going to meet up with some notable resistance above 103. That’s something to keep in mind going forward.

Bottom Line
We await multiple signals that the gold stock correction will have ended. Those would be a combination of technical, sector-fundamental (e.g. Gold/Oil ratio) and macro-fundamental (e.g. “real” yields, yield curve, etc.).
Anything can change at any time, but as of today the situation is as per the above. It’s got a few moving parts to it, but it’s not complicated.
While I personally have a few remaining exploration and royalty positions I did not want to get rid of (and have an acceptably moderate portfolio drawdown to show for it), NFTRH and its subscribers have been well prepared all along because we do not hope, chant, cheerlead, cry foul or anything other than try to deal in what is actually happening.
What has been happening began as a much needed correction in January, which has progressed in line with poor fundamentals. 2027 should be much different, with opportunity likely in Q4, 2026. Now, with a boat load of patience, comes the fun part.
