

Gold prices are retracing their year-end gains, testing support at the 20-Day moving average and raising questions about how deep the pullback may go, according to Bruce Powers, Technical Analyst and Global Market Strategist at FX Empire.
“Gold retraces 50% of the prior advance and finds support for the day at 2,031,” Powers wrote following the close of futures trading on Wednesday. “A successful test of support at the 20-Day MA also completed today at 2,034. Today is the second test of support at the 20-Day line, while the first was on December 15.”
Powers said it remains to be seen whether support will hold and prices will climb higher. “There are no signs of that yet,” he said. “Therefore, the expectation in the near-term is for a deeper retracement, but maybe not by much.”
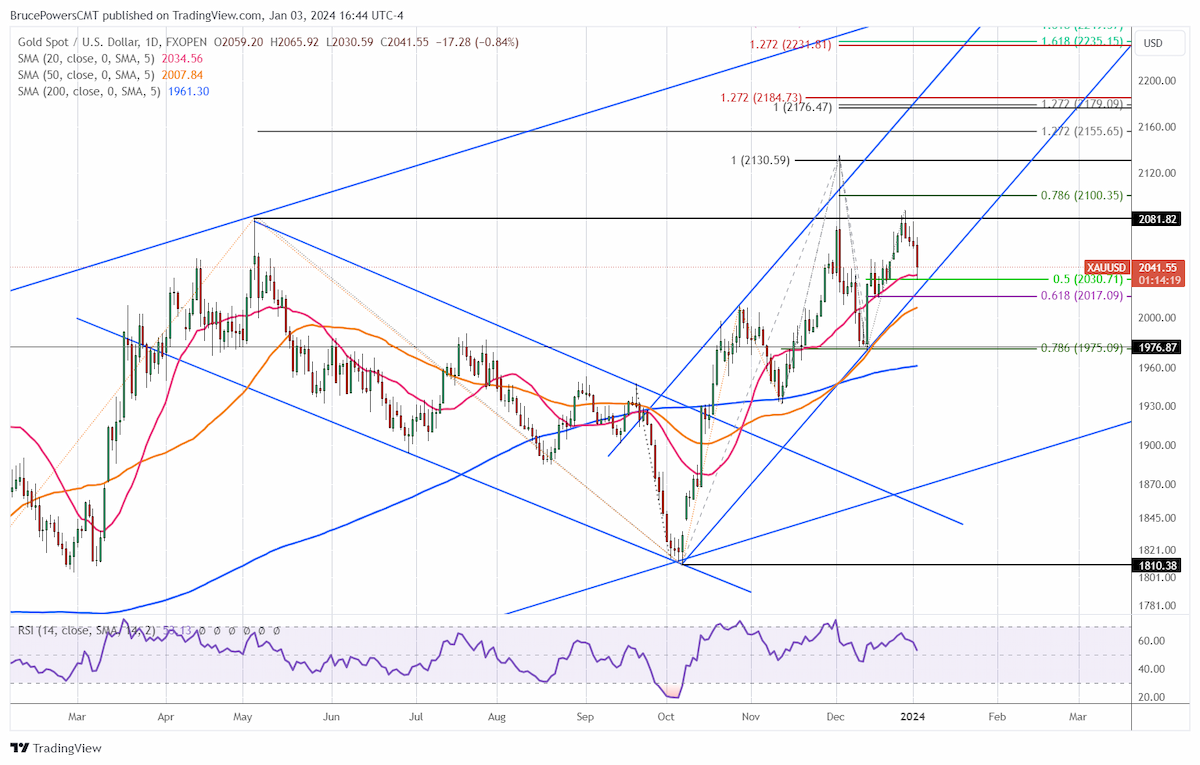
“There is likely support around the lower uptrend line, whose price will vary depending on when [it] is reached, and the 61.8% Fibonacci retracement at 2,017,” Powers said. “A little lower is the 50-Day MA at 2,008. Either of these levels may see demand increase. It seems like if gold is going to make a run for new highs in the foreseeable future, ideally, we would want to see the price structure of higher swing highs and lows retained in the rising trend channel.”
Powers noted that gold prices are currently within the third leg up in an uptrend that began from the swing low of $1,810 set in early October.
“There is both time and price symmetry between the first two moves, which may provide clues to the upside target for the third move,” he said. “The first advance from the October low saw the price of gold rise by 199 points or 11% in 15 days, while the second upswing was 203 or 10.5% in 15 days. This doesn’t mean that the third leg up in the trend will match the prior moves, but it could, or at least have some degree of mathematical relationship.”
The third leg of the uptrend, which started from the swing low of 1,973 set on Dec. 13, has successfully tested support at the 50-Day MA. “Given that the current leg up is on its thirteenth day, a match in time looks unlikely,” he said. “However, a similar move in price can be represented by the rising ABCD pattern where the CD leg equals the AB leg.”
“That pattern completes at a target of 2,176,” Powers concluded. “If reached, it will show a mathematical relationship between all three recent advances.”
Spot gold dipped as low as $2,036.62 just before 10 am EST on Thursday, and has since recovered somewhat, last trading at $2,044.68, up 0.16% at the time of writing.