
Bitcoin’s (BTC) price retested the lower support level of the range it has been trading in since Valentine's Day on Wednesday as macroeconomic factors, including higher for longer interest rates, continue to weigh on financial markets.
Data provided by TradingView shows that the top crypto broke below support at $52,000 in the early morning and slid to a low of $50,650 near midday before bulls managed to push it back above $50,900.

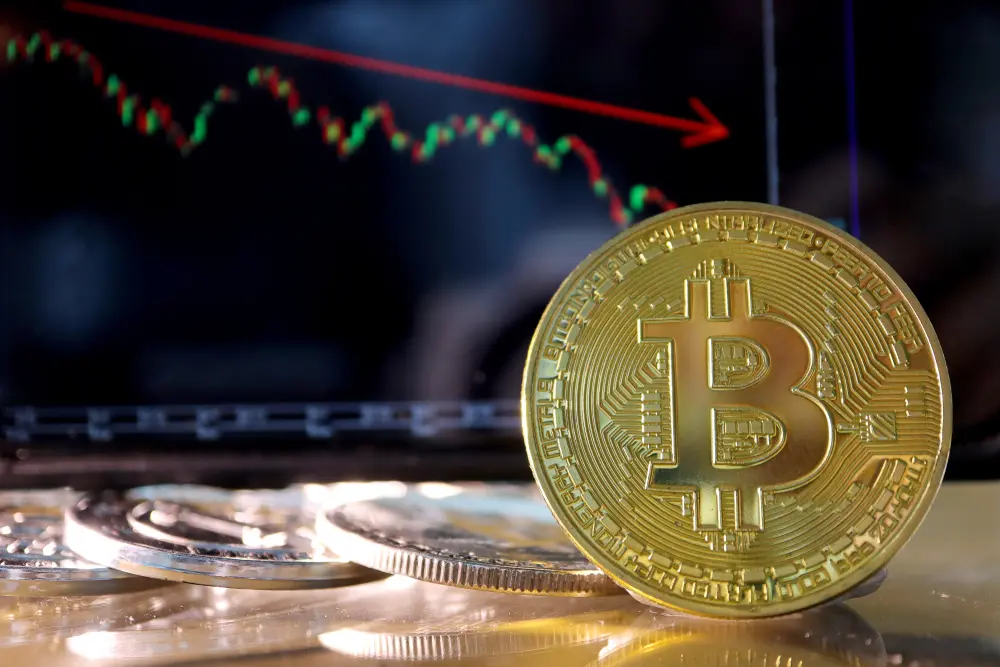
BTC/USD Chart by TradingView
The price decline comes despite continued inflows and heavy trading volumes for the U.S. spot Bitcoin exchange-traded funds (ETFs), which saw a surge in trading activity on Tuesday.
this is what grassroots demand looks like pic.twitter.com/HXa9kOLU2z
— thiccy (@thiccyth0t) February 20, 2024
According to a report by Bitfinex Alpha, the ETFs recorded net inflows exceeding $2.2 billion for the second consecutive week between Feb. 12-16.
Last week, BTC hit a high of $52,700, Bitfinex noted, which represented an increase of 25% since the beginning of the year and a 207% increase from its November 2022 lows. “This put BTC at just 28.6 percent below its all-time high, with supply tight and demand increasing even at higher price levels,” the report said.

“BTC has now reached the same level that provided support in November 2021 before a collapse across digital assets led us into the bear market of 2022,” Bitfinex said. “As the market progressively approaches the 2021 highs, the supply of BTC priced above the current YTD high is diminishing, indicating a tightening of available supply at these higher price levels.”
The price appreciation has resulted in “a substantial majority of BTC” transitioning into profit, the report said, noting that “approximately only 11 percent of the total Bitcoin supply was purchased at prices above $50,000, and are therefore still held at a loss.”
According to market analyst Ali Martinez, “The TD Sequential indicator shows a sell signal on the #Bitcoin 3-day chart.”

The TD (Tom Demark) Sequential is a counter-trend technical analysis tool designed to identify the exact moment of trend exhaustion and price reversal.
“It's important to note that the last two times this indicator signaled bearish, $BTC experienced a 10% price correction!” Martinez said.
While data provided by Alternative shows that the market is now in “Extreme Greed” territory, market intelligence platform Santiment noted that “Despite #Bitcoin's +74% price rise in 4 months, the crowd #FOMO that would normally be associated with this kind of surge has not been present.”

“There was certainly an interest in $BTC in the weeks directly before and after the #SEC's approval of 11 #ETF's, but the lack of new greed in the space can actually be considered a promising sign that this rally can continue,” Santiment said.
The firm said to “watch for a sudden major rise in overall #crypto platform discussion (presumably due to over-zealous traders) as a sign that we may be nearing a local market top.”
While multiple analysts have warned that Bitcoin may be in the process of topping in the near term, technical analyst Gert van Lagen noted that the 1-month chart looks promising and “Everything [is] in place for a parabolic move to $200k.”
$BTC [1M] - Everything in place for a parabolic move to $200k, compare ?'s:
+ Green Fibonacci resistance is broken;
+ Monthly RSI has entered bullish territory.#blowofftop pic.twitter.com/Qgnr0l6ZGx— Gert van Lagen (@GertvanLagen) February 21, 2024