

(Kitco News) – Bitcoin (BTC) bulls are fighting to regain lost ground in early trading on Monday after the top crypto plunged to a low of $52,552 on Friday, its lowest price since the early August pullback across markets sparked by the unwind of the Japanese yen carry trade.
“The crypto market is trying to stabilize around the $1.94 trillion mark for the third day (+0.8% in 24 hours and -4% in 7 days) after Friday's sharp sell-off,” noted Alex Kuptsikevich, senior market analyst at FxPro. “It will soon be apparent whether support at the $2 trillion level has turned into resistance.”
“Bitcoin is trading just below $55K on Monday morning, near the bottom of the downward corridor that has been in place since March,” he added. “Technical indicators are pointing to a possible bounce as the price has moved out of the oversold territory on the daily timeframe, which has preceded rallies several times over the past three months.”
Data provided by TradingView shows that Bitcoin rallied to a high of $55,808 since Kuptsikevich wrote his note, but risks falling back to lower support levels after a high-wicking candle on the 4-hour chart has now turned red.
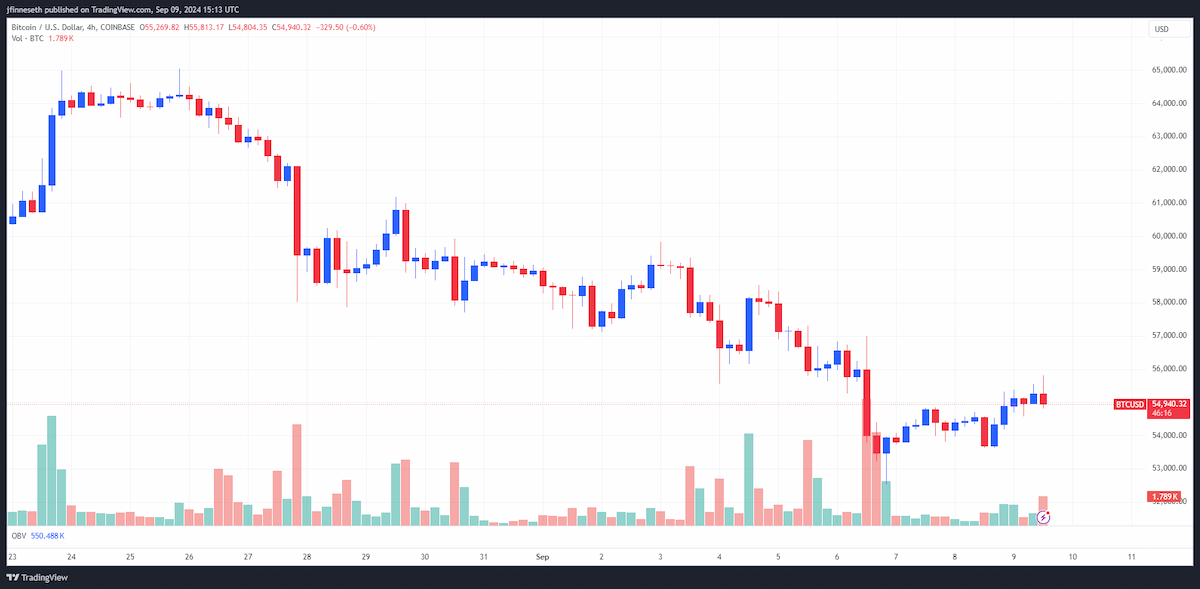
BTC/USD Chart by TradingView
“BTC continues to trade within the flag pattern (blue channel) and the fact that it hasn’t broken higher with the advent of September has people nervous,” said John Glover, Chief Investment Officer of Ledn. “This is a positive as long positions are being reduced, which will only add to buying pressure once the $73k price point has been breached.”
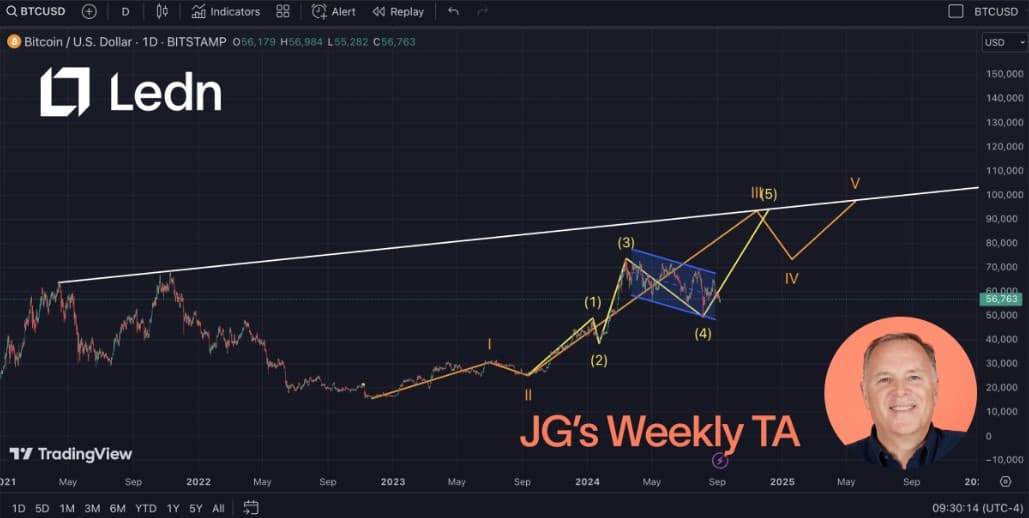
“The completion of wave 5 (yellow), which will also mark the completion of Wave III (orange), will likely be capped at the rising trendline resistance from the highs in May and November 2021 (white line),” he added. “This is bang in line with the Elliott Wave projections. The key level to watch on the downside remains at $49k, and a break below this level will bring a world of hurt to the longs. I continue to assign this outcome a low probability.”
Despite the volatility, Bitcoin continues to trade at the lower end of the range it has been trading in since late February, with market watchers focused on the Fed and interest rate cuts to help provide the next boost to momentum.
“Bitcoin has been basically trading sideways for the past 6 months following the massive surge at the start of the year due to the introduction of the BTC ETF,” said TradingView analyst TradingShort. “There might be no better way to illustrate this 6-month ranged trend than the current chart on the 1W time-frame.”
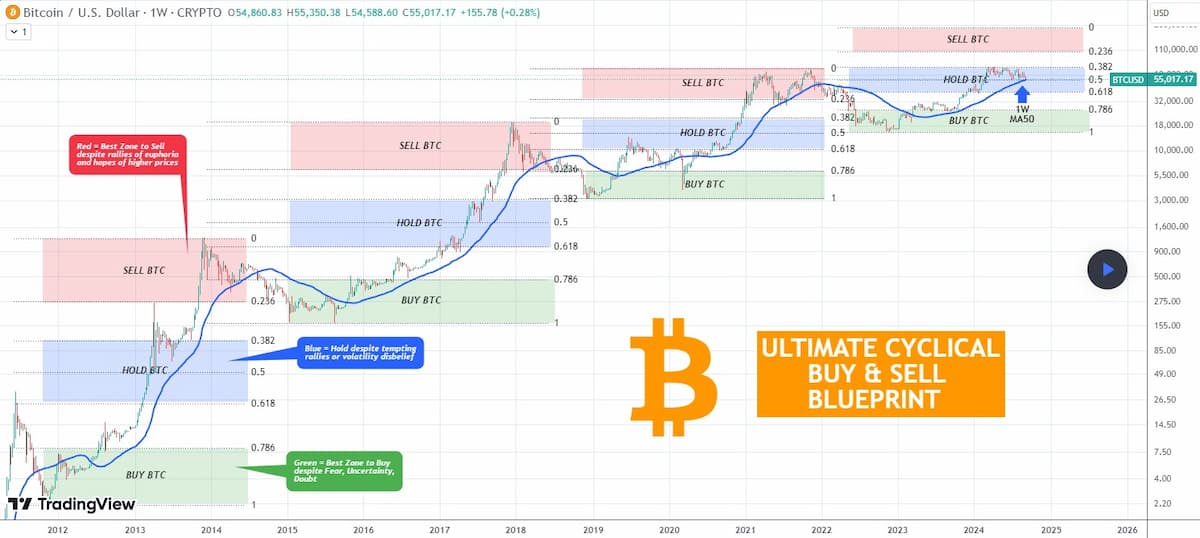
“On this chart, we depict BTC's Cycles in terms of Zones of BUY-HOLD-SELL,” he said. “As you can see, the first two Cycles placed their previous tops just above the 0.618 Fibonacci level, while the most recent one was just below the 0.382 Fib.”
“We've found that the 1.0 - 0.786 (Green) Fib Zone is usually the best Zone to Buy, despite the FUD (Fear, Uncertainty, Doubt) investors may have at the time due to the concluding Bear Cycle,” he noted. “All these emotions are normal to have under those circumstances but it's those that traders need to filter out and make the cold decision to buy.”
TradingShot identified “The 0.618 - 0.382 (Blue) Fib Zone” as the level “where investors are encouraged to do nothing and just Hold BTC, despite the temptation to sell and take profits after the first strong rallies of the new Bull Cycle or at times when volatility hits the market and disbelief of Bull Cycle continuation makes its presence.”
“The 0.236 - 0.0 (Red) Fib Zone is the best Zone to Sell, even if successive rallies hit euphoria to very high levels, making investors expect/ hope that the Bull Cycle will continue to higher and higher levels,” he added.
Putting it all together and “assuming that the current Cycle will have the previous top just below its 0.382 Fib (such as the previous Bull Cycle 2019 - 2021), we can clearly see the potential Zones of Action,” TradingShot said.
“The 1.0 - 0.786 Fib Zone (Buy) was from the moment of the 15.5k Bear Cycle bottom until Bitcoin roughly broke above the 1W MA50 (blue trend-line) again,” he highlighted. “Then it flashed its Buy Signal every time the March - October 2023 consolidation bottomed and pierced through the 0.786 Fib.”
Based on this data, TradinShot said it’s “obvious that the recent 6-month consolidation (March 2024 - now) we talked [about] at the start is nothing but the usual cyclical Hold Action (0.618 - 0.382 Fib) for Bitcoin. In fact, as you can see, this sideways trading has been taking place at the upper level of the Hold Zone within the 0.5 - 0.382 Fib.”
“With the 1W MA50 tested again last week (2nd time since the first week of August) and so far holding, the market is making a case that we are in cyclical terms on the 'No-Action' region of the Cycle, and most likely shouldn't sell despite the disbelief and fear that the recent 6-month ranged trend may have caused,” he concluded. “The time to start selling, if the model is materialized, will be at exactly 100k (0.236 Fib) and potentially lasting up to just below the 200k mark (0.0 Fib).”
At the time of writing, Bitcoin trades at $54,970, an increase of 1.64% on the 24-hour chart.
